CFDs are complex instruments and come with a high risk of losing money rapidly due to leverage. You should consider whether you understand how CFDs work and whether you can afford to take the high risk of losing your money.
    Mitrade Insights is dedicated to providing investors with rich, timely and most valuable financial information to help investors grasp the market situation and find timely trading opportunities.
    2021
    Best News & Analysis Provider
    FxDailyInfo
    2022
    Best Forex Educational Resources Global
    International Business Magazine

    NZD/JPY Price Analysis: Seller control the short term,overall trend remains bullist

    Source Fxstreet
    Apr 16, 2024 19:55
    • The daily RSI reveals that market momentum is currently dominated by sellers.
    • The daily MACD presents flat green bars, indicating a lack of buying traction.
    • In the hourly chart, the RSI shows slight improvement, suggesting sellers losing some ground.

    The NZD/JPY stabilized at around 90.94 and managed to clear most of its daily losses. However, in the shorter time frames, there are signs of a bullish recovery.

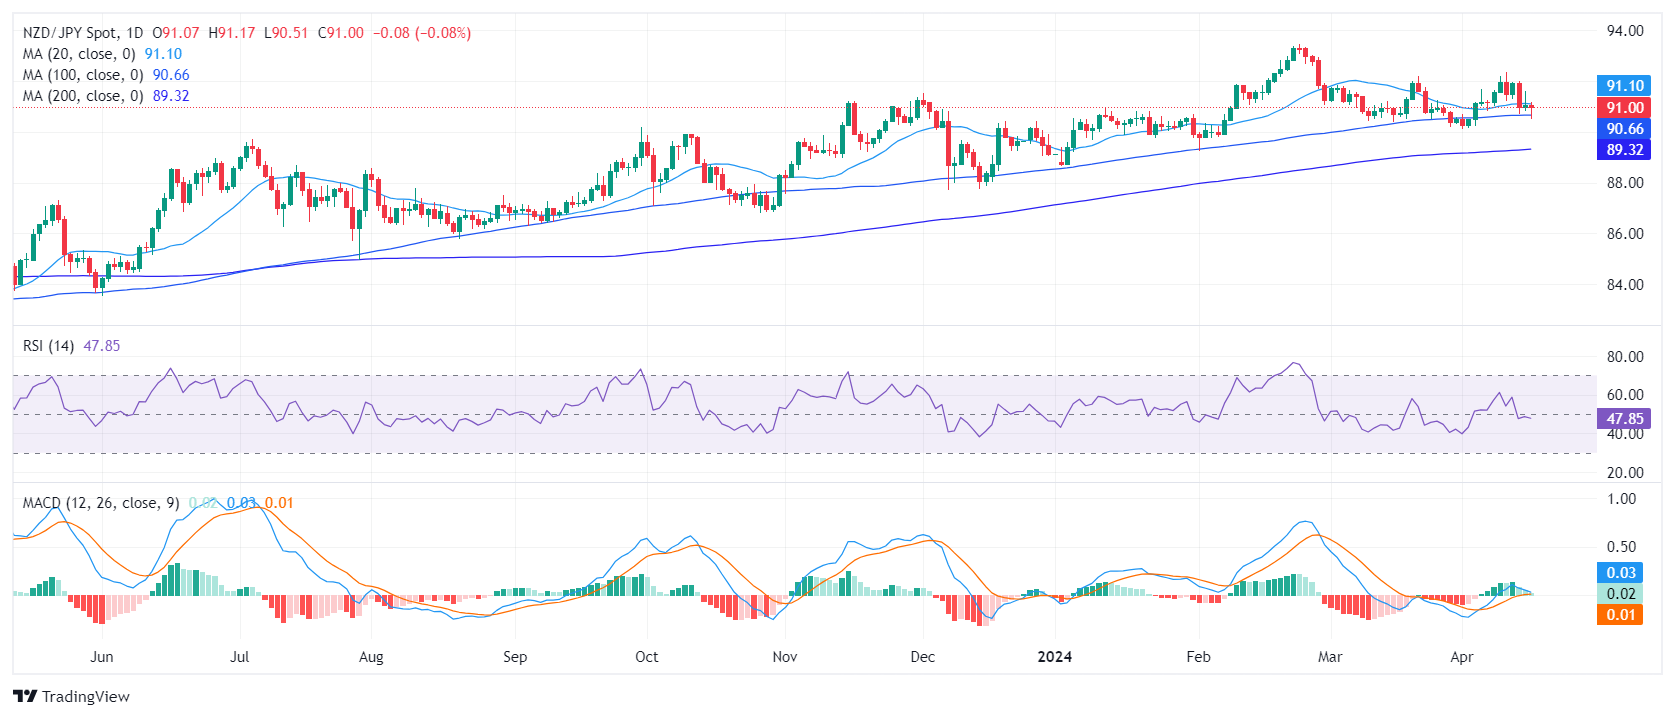
    The daily Relative Strength Index (RSI) hovers in the negative territory. The most recent reading fell to 48, reflecting a market momentum currently dominated by sellers. Furthermore, the Moving Average Convergence Divergence (MACD) histogram prints flat green bars, indicating a lack of positive momentum.

    NZD/JPY daily chart
    Transitioning to the hourly chart, the RSI seems to confirm the tepid sentiment observed on the daily chart. The most recent reading also lands in the 48 range. Nevertheless, signs of slight improvement towards the positive territory appear in the RSI and the latest session reading climbed from a preceding low of 41. Moreover, the MACD histogram on the hourly chart prints green bars, suggesting a possible pick-up in positive momentum.

    NZD/JPY hourly chart
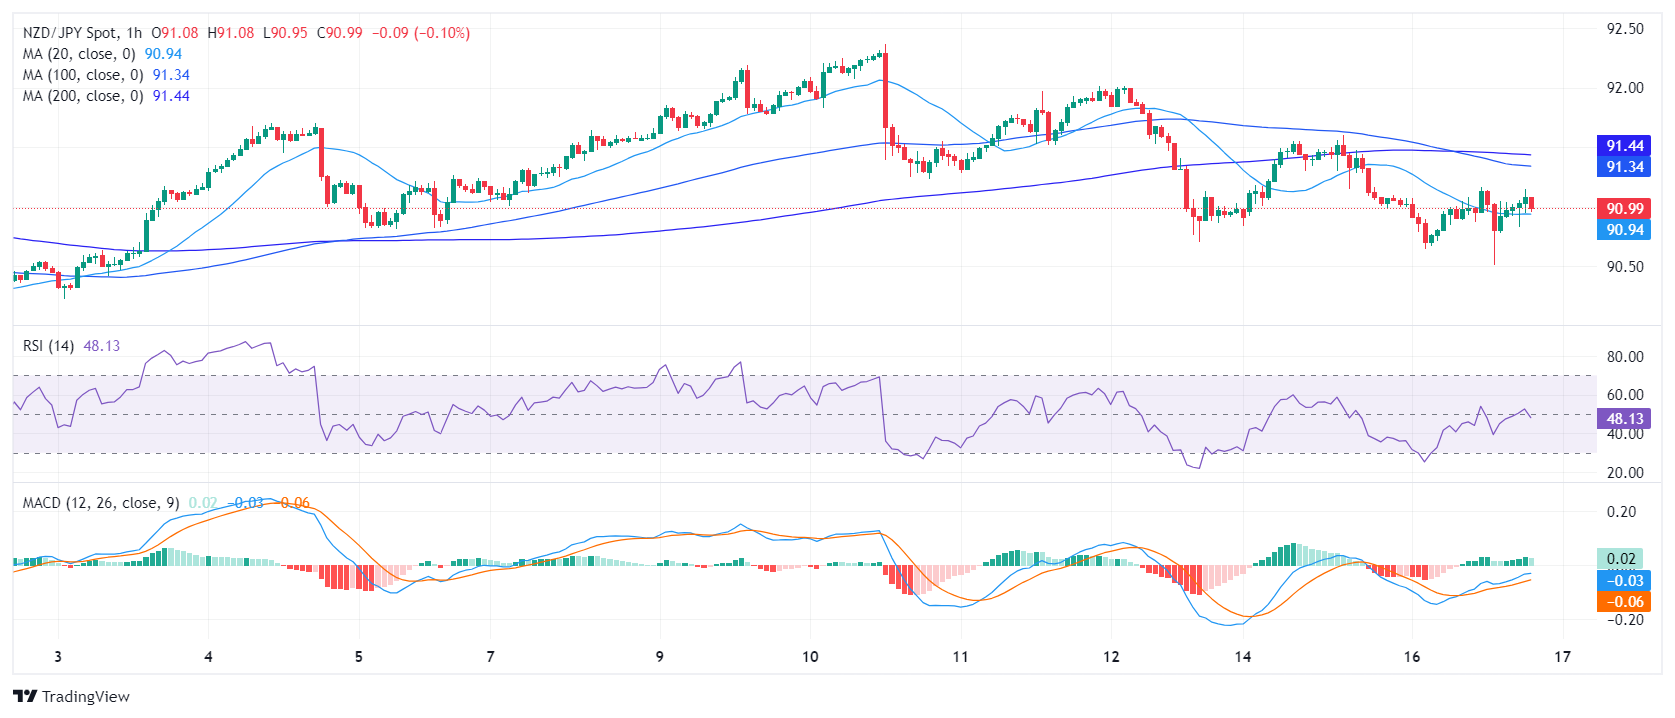
    The broader outlook, on the other hand, suggests that the bulls control the overall trend, but as long as the buyers fail to reclaim the 20-day Simple Moving Average (SMA), the short-term outlook will remain tilted in favor of the buyers.


    NZD/JPY

    Overview
    Today last price 90.98
    Today Daily Change -0.09
    Today Daily Change % -0.10
    Today daily open 91.07
     
    Trends
    Daily SMA20 91.12
    Daily SMA50 91.39
    Daily SMA100 90.65
    Daily SMA200 89.3
     
    Levels
    Previous Daily High 91.6
    Previous Daily Low 90.84
    Previous Weekly High 92.37
    Previous Weekly Low 90.7
    Previous Monthly High 92.2
    Previous Monthly Low 90.17
    Daily Fibonacci 38.2% 91.31
    Daily Fibonacci 61.8% 91.13
    Daily Pivot Point S1 90.74
    Daily Pivot Point S2 90.4
    Daily Pivot Point S3 89.97
    Daily Pivot Point R1 91.51
    Daily Pivot Point R2 91.94
    Daily Pivot Point R3 92.27


    Disclaimer: For information purposes only. Past performance is not indicative of future results.
    placeholder
    EUR/USD hovers around 1.0700, eyes on US first-quarter GDP dataThe EUR/USD pair hovers around the 1.0700 psychological level on Thursday during the early Asian session.
    Source  Fxstreet
    The EUR/USD pair hovers around the 1.0700 psychological level on Thursday during the early Asian session.
    placeholder
    EUR/GBP Price Analysis: Downmove reaches critical support levelEUR/GBP price has reversed and fallen to a key support level at around 0.8590, where it is currently consolidating.
    Source  Fxstreet
    EUR/GBP price has reversed and fallen to a key support level at around 0.8590, where it is currently consolidating.
    placeholder
    USD/CAD remains subdued around 1.3650 due to higher crude prices, disappointing US PMIUSD/CAD continues its losing streak that began on April 17, trading around 1.3660 during the Asian session on Wednesday.
    Source  Fxstreet
    USD/CAD continues its losing streak that began on April 17, trading around 1.3660 during the Asian session on Wednesday.
    goTop
    quote