EUR/USD Price Analysis: Holds above psychological level of 1.0600 amid a bearish sentiment

Source Fxstreet
  • EUR/USD could test the support at the psychological level of 1.0600.
  • The pair could extend losses to November’s low at 1.0516 as Technical analysis suggests a bearish confirmation.
  • The area around the major level of 1.0650 and the 23.6% Fibo level of 1.0672 appears as the resistance zone.

EUR/USD continues its losing streak for the sixth successive session on Tuesday, hovering near 1.0620 during the Asian trading hours. The US Dollar's (USD) strength put pressure on the EUR/USD pair, possibly driven by increased US Treasury yields. Additionally, stronger-than-anticipated Retail Sales data from the US has raised expectations that the Federal Reserve (Fed) might prolong its stance on higher interest rates.

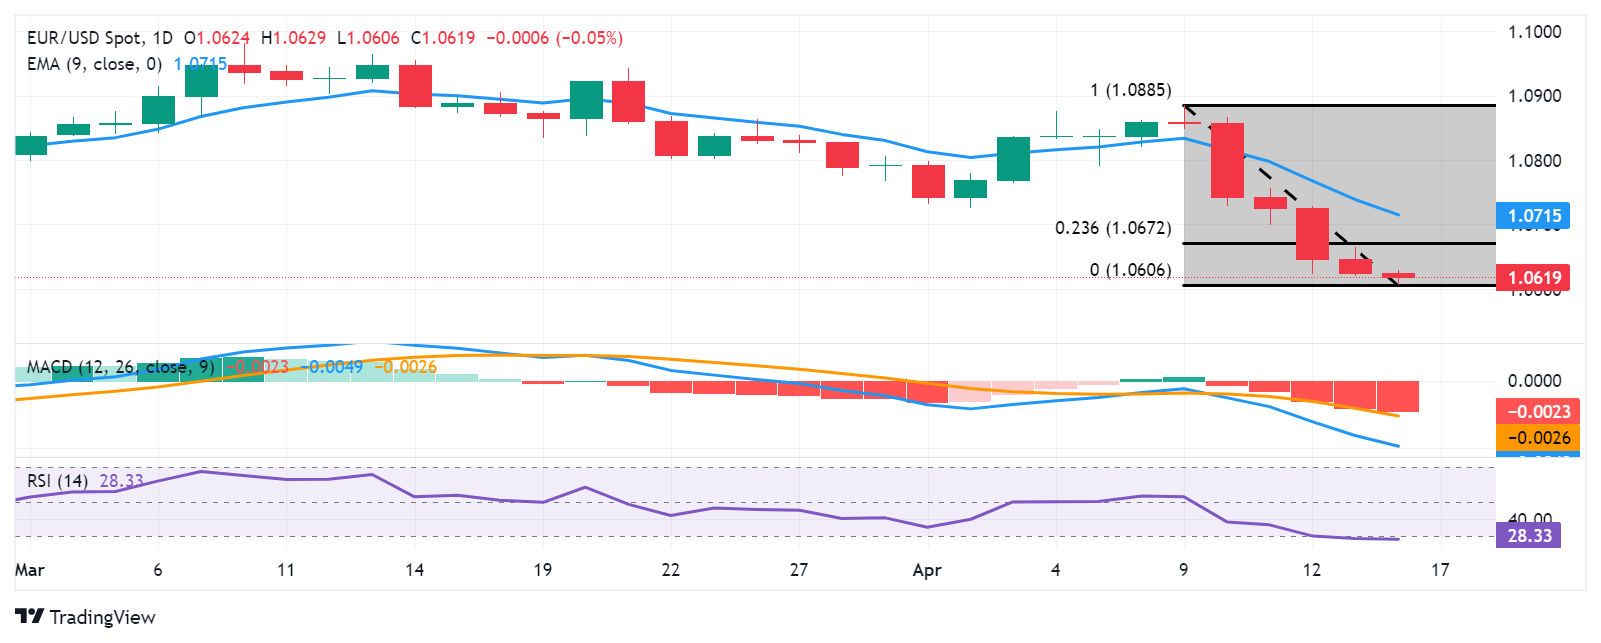
On the technical side, the analysis suggests a bearish sentiment for the EUR/USD pair as the 14-day Relative Strength Index (RSI) is positioned below the 50 mark. Additionally, the lagging indicator, Moving Average Convergence Divergence (MACD), lies below the centreline and shows a divergence below the signal line, which indicates weakness for the pair.

The EUR/USD pair could find immediate support around the psychological level of 1.0600. A break below this level could exert downward pressure on the pair to navigate the region around the major level of 1.0550, followed by November’s low at 1.0516.

On the upside, the major level 1.0650 appears as the key barrier, followed by the 23.6% Fibonacci retracement level of 1.0672. A breakthrough above the latter could lead the EUR/USD pair to explore the area around the psychological level of 1.0700 and the nine-day Exponential Moving Average (EMA) at 1.0715.

EUR/USD: Daily Chart

EUR/USD

Overview
Today last price 1.0617
Today Daily Change -0.0007
Today Daily Change % -0.07
Today daily open 1.0624
 
Trends
Daily SMA20 1.0801
Daily SMA50 1.0821
Daily SMA100 1.0864
Daily SMA200 1.0828
 
Levels
Previous Daily High 1.0665
Previous Daily Low 1.062
Previous Weekly High 1.0885
Previous Weekly Low 1.0622
Previous Monthly High 1.0981
Previous Monthly Low 1.0768
Daily Fibonacci 38.2% 1.0637
Daily Fibonacci 61.8% 1.0648
Daily Pivot Point S1 1.0608
Daily Pivot Point S2 1.0592
Daily Pivot Point S3 1.0563
Daily Pivot Point R1 1.0653
Daily Pivot Point R2 1.0682
Daily Pivot Point R3 1.0698


Disclaimer: For information purposes only. Past performance is not indicative of future results.
placeholder
Ethereum (ETH) Price Closes Above $3,900 — Is a New All-Time High Possible Before 2024 Ends?Once again, the price of Ethereum (ETH) has risen above $3,900. This bounce has hinted at a further price increase for the altcoin before the end of the year.
Author  Beincrypto
Dec 17, 2024
Once again, the price of Ethereum (ETH) has risen above $3,900. This bounce has hinted at a further price increase for the altcoin before the end of the year.
placeholder
Analyst Flags XRP as Market’s ‘Best Risk/Reward’ Play as Token Tests Critical $1.60 SupportCrypto analyst Scott Melker identifies a prime risk/reward setup for XRP as it tests key support at $1.60, offering a tight stop-loss against potential upside targets near $2.00.
Author  Mitrade
Feb 03, Tue
Crypto analyst Scott Melker identifies a prime risk/reward setup for XRP as it tests key support at $1.60, offering a tight stop-loss against potential upside targets near $2.00.
placeholder
Ethereum Price Forecast: ETH faces heavy distribution as price slips below average cost basis of investorsEthereum (ETH) extended its decline on Wednesday, dropping more than 5% over the past 24 hours toward the $2,100 level, which is below the $2,310 average cost basis or realized price of investors, according to CryptoQuant's data.
Author  FXStreet
Feb 05, Thu
Ethereum (ETH) extended its decline on Wednesday, dropping more than 5% over the past 24 hours toward the $2,100 level, which is below the $2,310 average cost basis or realized price of investors, according to CryptoQuant's data.
placeholder
Bitcoin Drops to $70,000. U.S. Government Refuses to Bail Out Market, End of Bull Market or Golden Pit? The U.S. government refuses to bail out Bitcoin, and with Fed rate cuts nowhere in sight, a continued downward trend to test for a bottom is likely after a brief rebound.During the mid-da
Author  TradingKey
Feb 05, Thu
The U.S. government refuses to bail out Bitcoin, and with Fed rate cuts nowhere in sight, a continued downward trend to test for a bottom is likely after a brief rebound.During the mid-da
placeholder
Bitcoin Surrenders $65,000 as Analysts Warn of ‘Structural’ Market BreakBitcoin plunges 11% to break $65k as analysts term the crash "structural," citing a $1 trillion market wipeout and $2.09 billion in daily liquidations.
Author  Mitrade
Feb 06, Fri
Bitcoin plunges 11% to break $65k as analysts term the crash "structural," citing a $1 trillion market wipeout and $2.09 billion in daily liquidations.
Related Instrument
goTop
quote