NZD/JPY Price Analysis: Bears advance and target the 20-day SMA

Source Fxstreet
  • The hourly chart indicators reveal a mounting selling pressure, hinting at a pause in bullish momentum.
  • To maintain the current bullish momentum, it's essential for the pair to uphold its standing above the key SMA.

The NZD/JPY pair declined near the 91.33 mark, indicating a battle between optimism favoring a bullish market and mounting bearish pressure. The market trend leans towards the bullish side as the pair stays above critical Simple Moving Averages (SMAs) levels; however, a shift in momentum toward downward forces suggests impending consolidation.

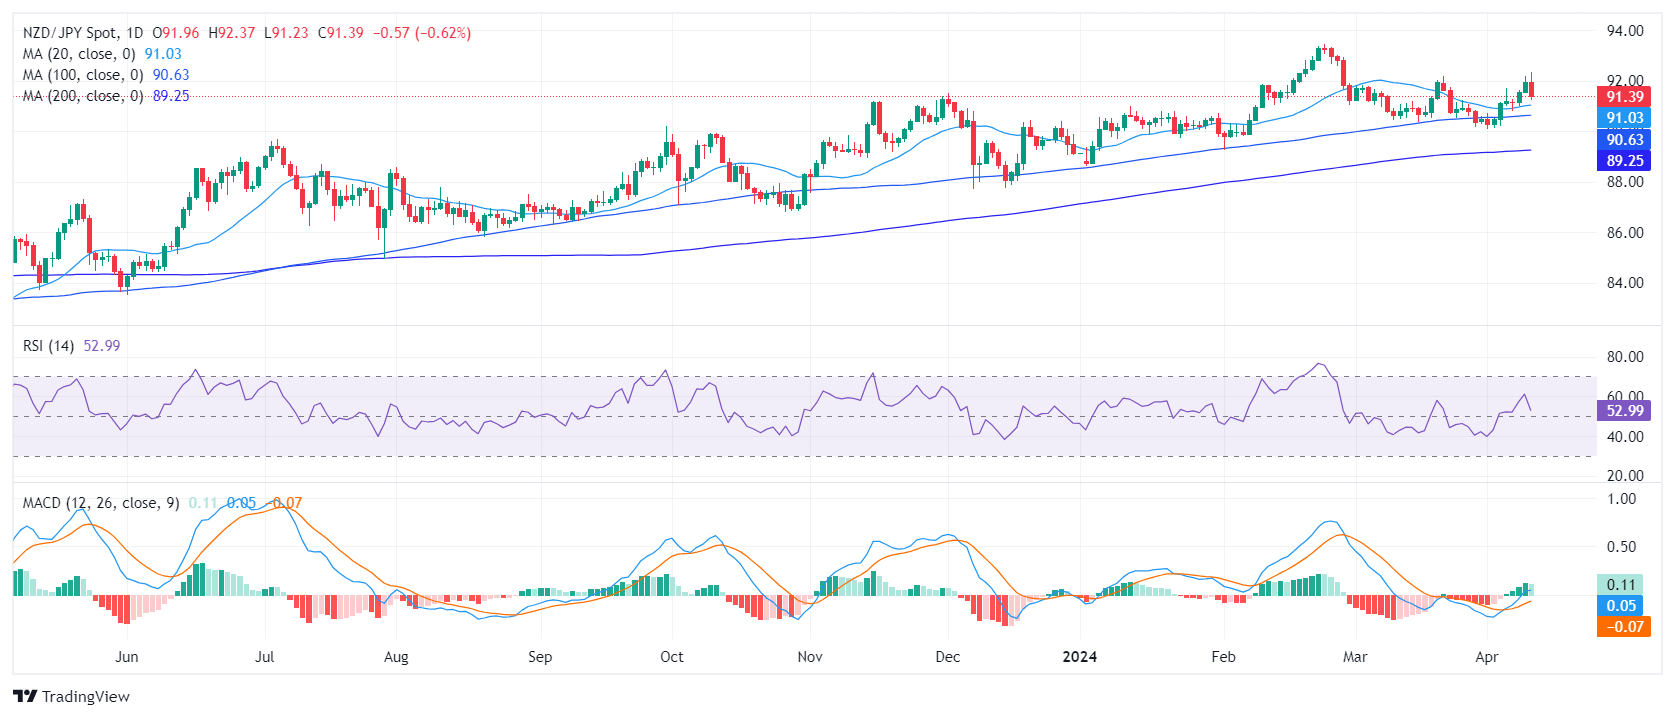
On the daily chart, the Relative Strength Index (RSI) is in positive territory, indicating a mild bullish momentum. Despite a recent decrease, the prevailing trend remains largely positive. The Moving Average Convergence Divergence (MACD) reveals decreasing green bars, also suggesting a slight loss in positive momentum. However, the persisting positive RSI readings indicate that the majority of traders favor the buy side.

NZD/JPY daily chart

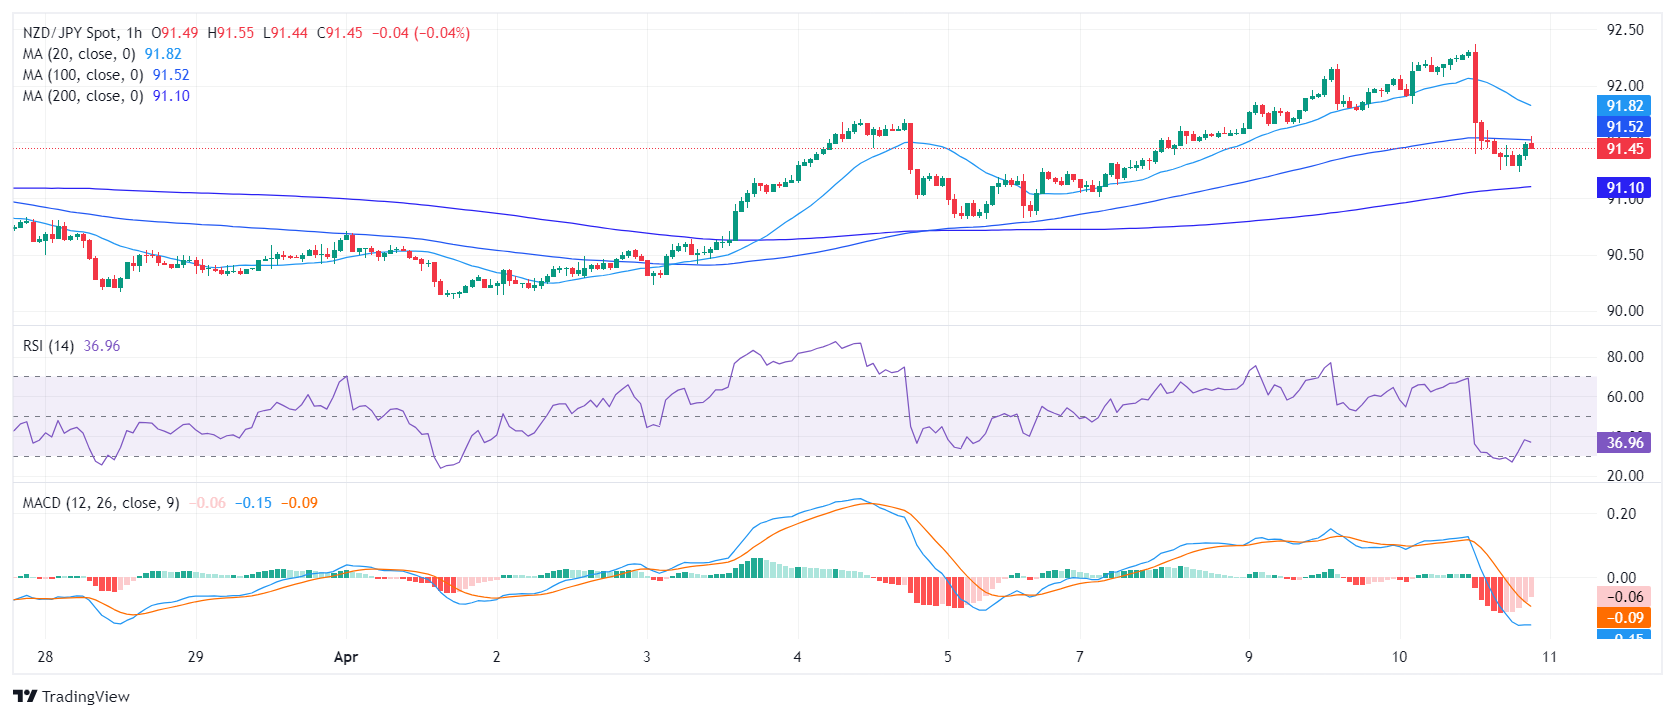
In the hourly analysis, the RSI hovers in the oversold territory, indicating strong selling pressure but as the downward movements are overextended an upward corrective move may be possible ahead of the Asian session. In addition, the MACD histogram prints red bars, adding arguments for the negative momentum.

NZD/JPY hourly chart

Inspecting the broader perspective, the NZD/JPY demonstrates a bullish trend with its current standing above the 20,100, and 200-day Simple Moving Averages (SMAs). However, the bears seem to be eyeing the 20-day SMA level of 91.00, which poses a significant turning point. A successful breach below this level could reinforce the arguments for the bears and the pair could see additional downside in the next sessions.


NZD/JPY

Overview
Today last price 91.48
Today Daily Change -0.48
Today Daily Change % -0.52
Today daily open 91.96
 
Trends
Daily SMA20 91.01
Daily SMA50 91.28
Daily SMA100 90.62
Daily SMA200 89.24
 
Levels
Previous Daily High 92.19
Previous Daily Low 91.55
Previous Weekly High 91.7
Previous Weekly Low 90.11
Previous Monthly High 92.2
Previous Monthly Low 90.17
Daily Fibonacci 38.2% 91.94
Daily Fibonacci 61.8% 91.79
Daily Pivot Point S1 91.61
Daily Pivot Point S2 91.26
Daily Pivot Point S3 90.97
Daily Pivot Point R1 92.25
Daily Pivot Point R2 92.54
Daily Pivot Point R3 92.89


Disclaimer: For information purposes only. Past performance is not indicative of future results.
placeholder
USD/JPY trades cautiously positive around 144.00 ahead of key US dataThe USD/JPY pair edges higher to near 143.90 during European trading hours on Thursday. The pair trades cautiously higher as the US Dollar (USD) ticks up ahead of the United States (US) Nonfarm Payrolls (NFP) data for June, which will be published at 12:30 GMT.
Author  FXStreet
Jul 03, 2025
The USD/JPY pair edges higher to near 143.90 during European trading hours on Thursday. The pair trades cautiously higher as the US Dollar (USD) ticks up ahead of the United States (US) Nonfarm Payrolls (NFP) data for June, which will be published at 12:30 GMT.
placeholder
Gold price fills opening gap amid subdued USD demand; bulls still seem reluctantGold price attracts some buyers near the $3,312-3,311 region during the Asian session on Monday and fills a modest bearish gap opening amid subdued USD price action.
Author  FXStreet
Jul 28, 2025
Gold price attracts some buyers near the $3,312-3,311 region during the Asian session on Monday and fills a modest bearish gap opening amid subdued USD price action.
placeholder
Gold edges higher as Fed rate cut bets undermine USD ahead of NFP dataGold (XAU/USD) edges higher during the Asian session on Friday and looks to build on the overnight bounce from the vicinity of the $3,500 psychological mark.
Author  FXStreet
Sep 05, 2025
Gold (XAU/USD) edges higher during the Asian session on Friday and looks to build on the overnight bounce from the vicinity of the $3,500 psychological mark.
placeholder
Silver Price Forecast: XAG/USD dips to near $72.50 as CME raises marginsSilver price (XAG/USD) has lost its nearly a 4.5% gain registered in the previous session, trading around $72.50 during the Asian hours on Wednesday.
Author  FXStreet
Dec 31, 2025
Silver price (XAG/USD) has lost its nearly a 4.5% gain registered in the previous session, trading around $72.50 during the Asian hours on Wednesday.
placeholder
When is the US President Trump’s speech at WEF in Davos and how could it affect EUR/USDUnited States (US) President Donald Trump is scheduled to deliver his speech at the World Economic Forum (WEF) in Davos after 13:00 GMT. Trump’s trip to Davos was delayed after Air Force One was forced to turn around due to a "minor electrical issue".
Author  FXStreet
Jan 21, Wed
United States (US) President Donald Trump is scheduled to deliver his speech at the World Economic Forum (WEF) in Davos after 13:00 GMT. Trump’s trip to Davos was delayed after Air Force One was forced to turn around due to a "minor electrical issue".
Related Instrument
goTop
quote