
USD/CAD Price Forecast: Stays above 1.3900 due to prevailing bullish bias
- USD/CAD may target the five-month high at 1.4016.
- The 14-day Relative Strength Index holds above the 50 mark, reinforcing the bullish bias.
- The primary support lies at the nine-day EMA of 1.3884.
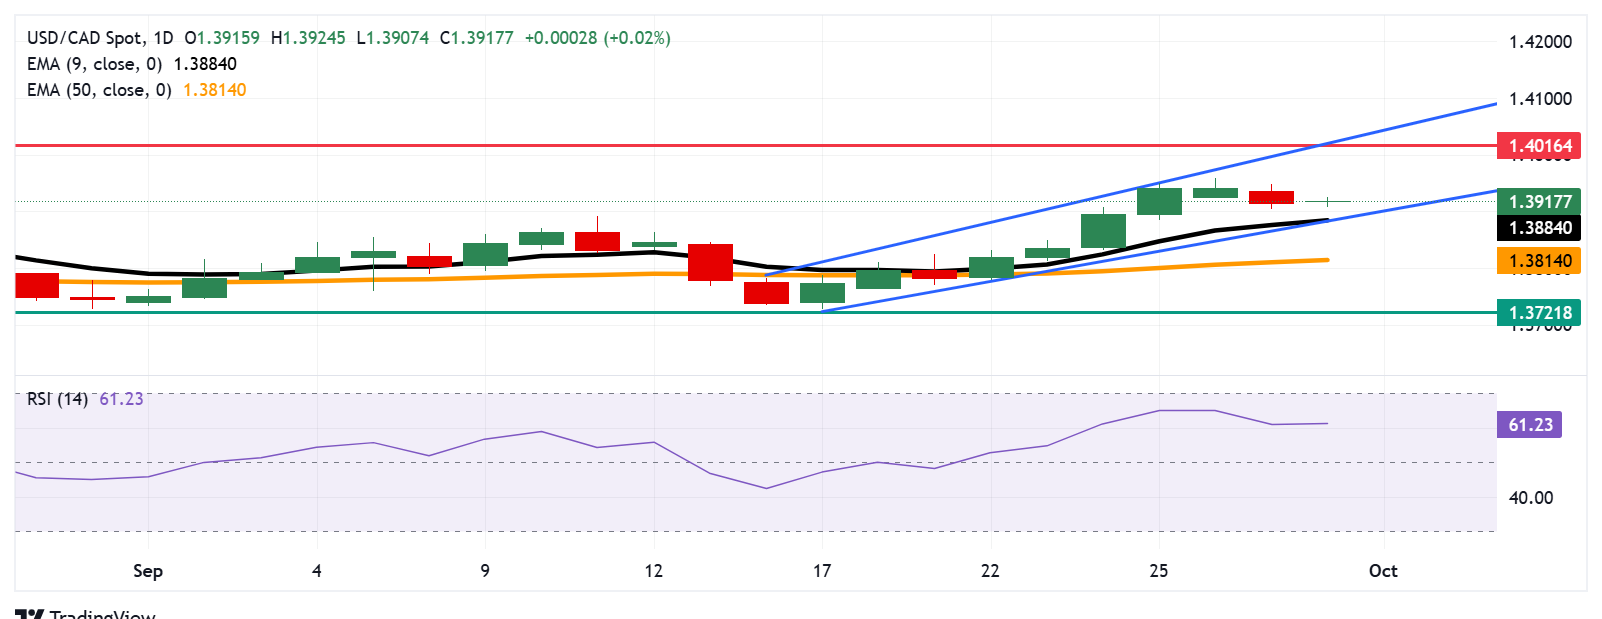
USD/CAD trades around 1.3910 during the European hours on Tuesday, remaining steady after registering losses in the previous session. The technical analysis of the daily chart suggests that the pair remains within an ascending channel pattern, suggesting that a prevailing bullish bias.
The 14-day Relative Strength Index (RSI) stays above the 50 level, strengthening the bullish bias. Additionally, the USD/CAD pair is positioned above the nine-day Exponential Moving Average (EMA), indicating the short-term price momentum is strengthening.
On the upside, the USD/CAD pair may approach the five-month high at 1.4016, which was reached on May 13, aligned with the upper boundary of the ascending channel around 1.4020. Further advances above the channel would strengthen the bullish bias and support the pair to target the psychological level of 1.4100.
The USD/CAD pair may find its initial support at the nine-day EMA of 1.3884, aligned with the ascending channel’s lower boundary around 1.3880. Further declines below this crucial support zone would weaken the bullish bias and put downward pressure on the pair to test the 50-day EMA at 1.3814.
A break below the 50-day EMA would dampen the medium-term price momentum and put downward pressure on the USD/CAD pair to navigate the region around the two-month low of 1.3721, which was recorded on August 7.
USD/CAD: Daily Chart
Canadian Dollar Price Today
The table below shows the percentage change of Canadian Dollar (CAD) against listed major currencies today. Canadian Dollar was the strongest against the US Dollar.
| USD | EUR | GBP | JPY | CAD | AUD | NZD | CHF | |
|---|---|---|---|---|---|---|---|---|
| USD | -0.12% | -0.08% | -0.44% | 0.03% | -0.23% | -0.32% | -0.24% | |
| EUR | 0.12% | 0.02% | -0.33% | 0.14% | -0.10% | -0.20% | -0.08% | |
| GBP | 0.08% | -0.02% | -0.34% | 0.14% | -0.14% | -0.23% | -0.10% | |
| JPY | 0.44% | 0.33% | 0.34% | 0.45% | 0.23% | 0.29% | 0.26% | |
| CAD | -0.03% | -0.14% | -0.14% | -0.45% | -0.25% | -0.33% | -0.26% | |
| AUD | 0.23% | 0.10% | 0.14% | -0.23% | 0.25% | -0.11% | 0.03% | |
| NZD | 0.32% | 0.20% | 0.23% | -0.29% | 0.33% | 0.11% | 0.14% | |
| CHF | 0.24% | 0.08% | 0.10% | -0.26% | 0.26% | -0.03% | -0.14% |
The heat map shows percentage changes of major currencies against each other. The base currency is picked from the left column, while the quote currency is picked from the top row. For example, if you pick the Canadian Dollar from the left column and move along the horizontal line to the US Dollar, the percentage change displayed in the box will represent CAD (base)/USD (quote).
Recommended Articles


