


NZD/USD declines on dovish RBNZ stance
- RBNZ Governor Orr was seen dovish, which seems to be applying pressure to the NZD.
- GDP and Initial Jobless Claims cushion the USD. Weak Chicago PMI figures limit the upside.
- Markets adjusted their expectations for a June rate cut which also adds strength to the USD.
The NZD/USD is currently traded at 0.5977, reflecting a decrease of 0.43%. The pair's movement was influenced by somewhat dovish comments from the Reserve Bank of New Zealand (RBNZ) Governor Orr and by mixed data from the US. Ahead of Friday’s session, markets await Personal Consumption Expenditures (PCE) data from the US from February.
RBNZ Governor Orr commented that inflation is normalizing while aggregate demand is slowing which would lead to a low and stable inflation on the horizon in hand with normalized interest rates. As a reaction markets are betting on 75 bps of easing in 2024, while the RBNZ hinted that the first cut would come in 2025 and as long as markets underestimate the bank, the NZD may suffer additional losses.
On the USD side, The recent release of Initial Jobless Claims data showed figures slightly below the consensus, with 210K reported against the anticipated 215K for the week ending on March 23. Additionally, the Q4 Gross Domestic Product (GDP) was revised upwards, showcasing a yearly growth of 3.4%. However, not all economic indicators were positive; the March Chicago Purchasing Managers Index (PMI) data from the Institute for Supply Management fell short of expectations, coming in at 41.4 against the forecasted 46 and previous 44.
Regarding the Federal Reserve (Fed) expectations, the probability of a rate cut in June has decreased to 66% from 85% earlier in the week, providing some support to the Greenback. That being said, the release of the headline Personal Consumption Expenditures (PCE) on Friday, will likely fuel volatility markets as investors may readjust their bets on the Fed.
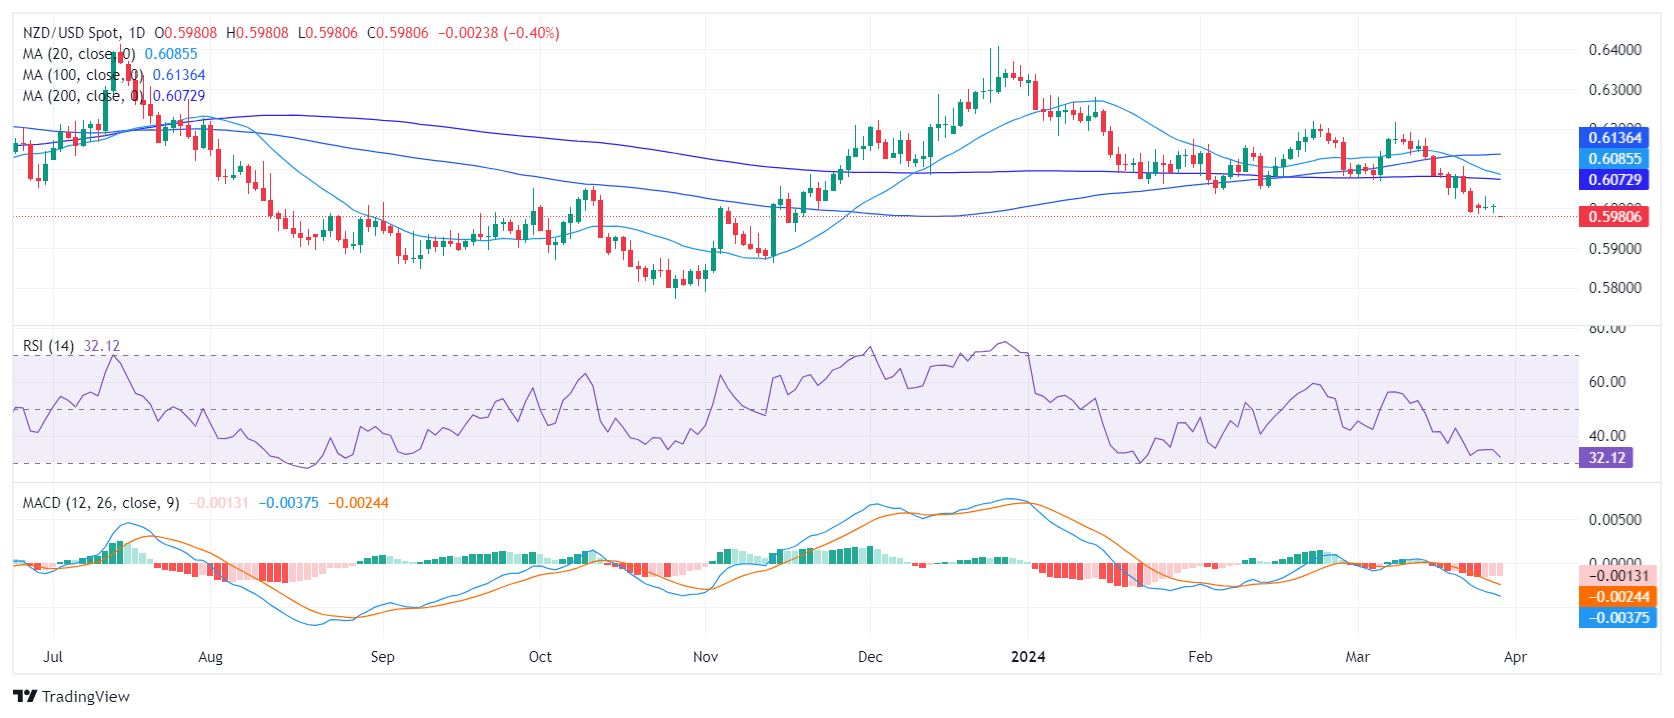
NZD/USD technical analysis
On the daily chart, the NZD/USD pair's Relative Strength Index (RSI) is notably fixated within negative territory. The latest RSI reading swings back to a negative trend, marking a score of 33 which suggests a strong bearish sentiment in the market. Concurrently, the Moving Average Convergence Divergence (MACD) histogram prints red bars, evidencing a negative momentum that further reinforces the downward pressure on this currency pair.
Moving to the Simple Moving Average (SMA) analysis, the pair is trading below the respective 20, 100, and 200-day Simple Moving Averages (SMAs), supporting the continuing negative trend.
NZD/USD daily chart
Recommended Articles


