NZD/USD Price Analysis: Bears exert pressure, yet short-term bullish reversal seems possible

Source Fxstreet
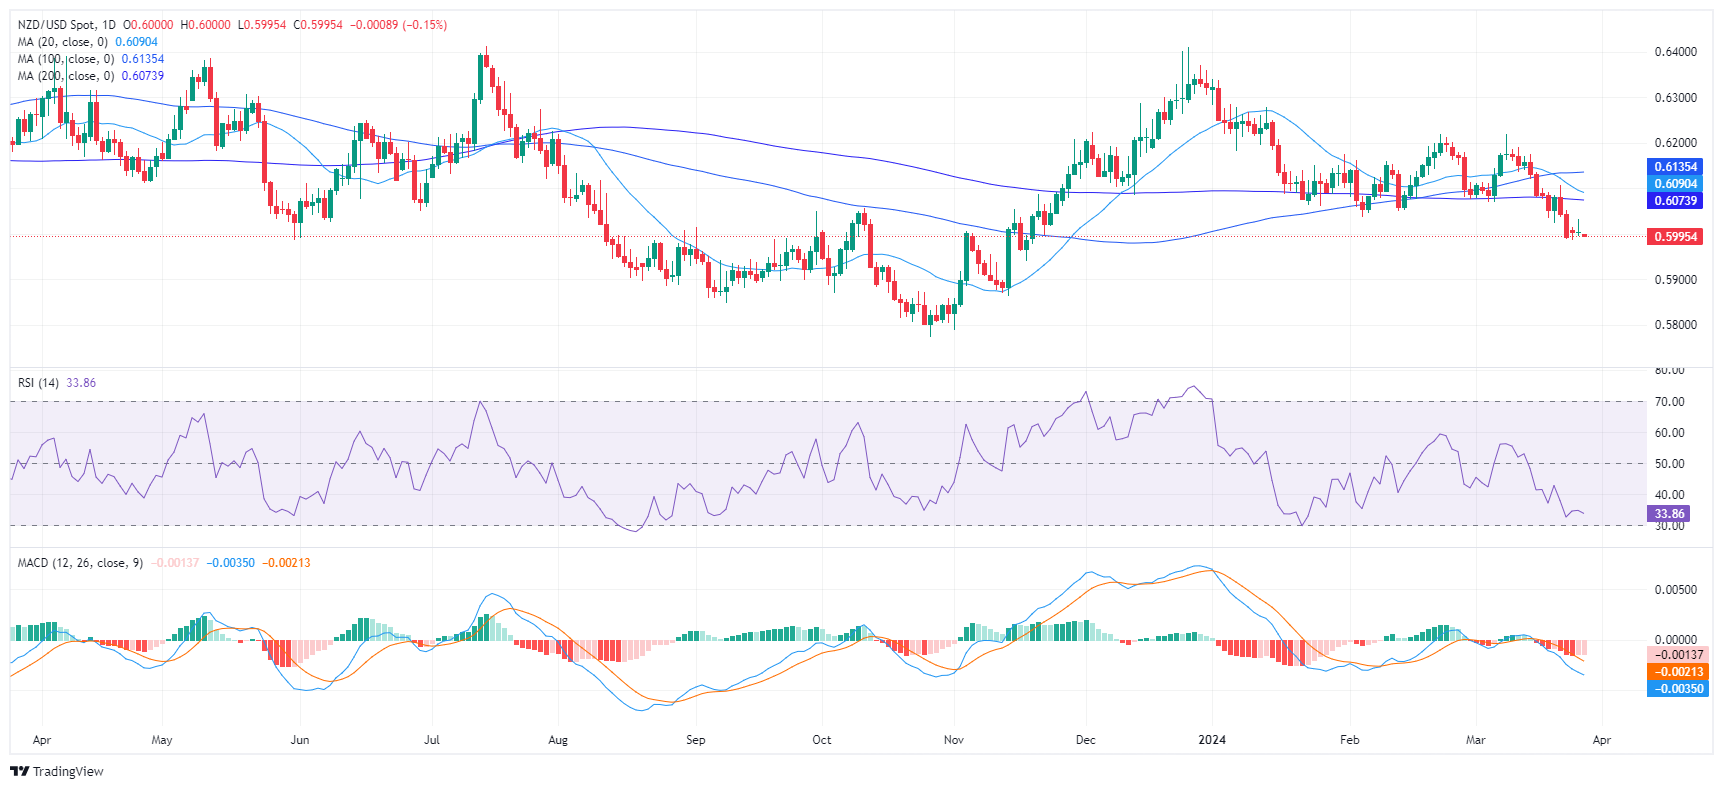
  • Rising seller traction is prevalent in the daily chart with the RSI deep in the negative area.
  • The hourly chart signals a potential shift toward short-term bullish correction.
  • The overall trend continues to be tilted to the downside.

The NZD/USD pair is operating at around 0.6000 with losses, The market landscape is primarily dominated by sellers, underscored by a prevailing negative trend. The pair resides below the important 20, 100, and 200-day Simple Moving Averages (SMAs), emphasizing the strong presence of sellers. However, the hourly chart has clues for a potential short-term bullish reversal.

The Relative Strength Index (RSI) oscillates within the negative territory on the daily chart. at 35 near the oversold area, underscoring the prominence of sellers in the market. Concurrently, the predominance of flat red bars in the Moving Average Convergence Divergence (MACD) histogram affirms this negative momentum.

NZD/USD daily chart

Switching to the hourly chart, the RSI moved towards its middle point but then retreated towards 40, implying a modest bias towards the buyers. In addition, the MACD histogram prints green bars which offer additional evidence of buyers gathering momentum.

NZD/USD hourly chart

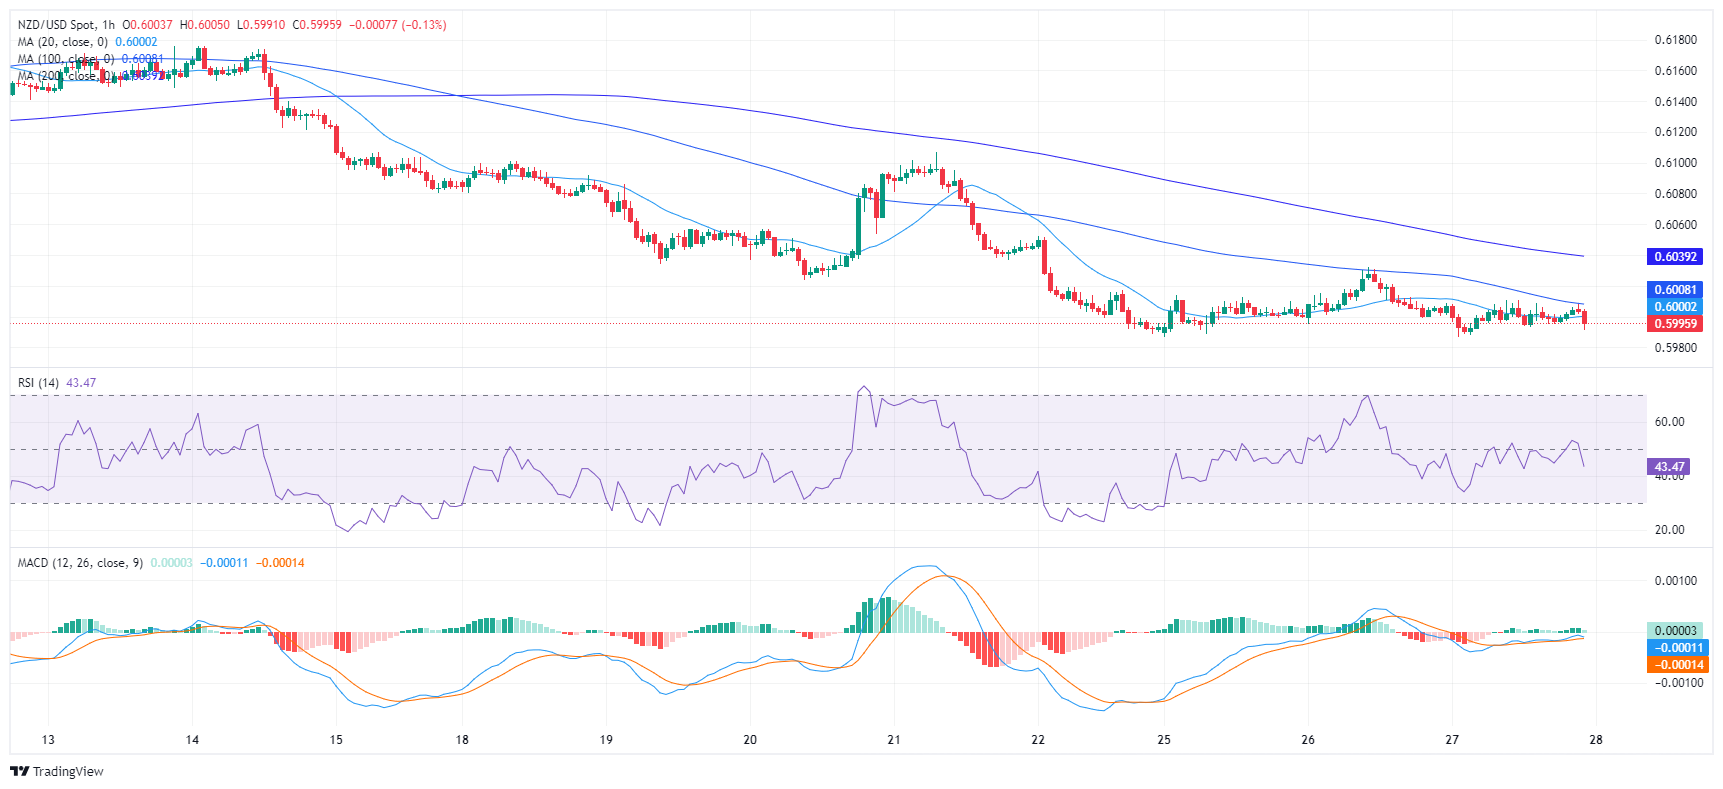
Overall, the current dynamics of the NZD/USD pair infer a predominantly negative momentum. Nevertheless, the recovering indicators in the hourly chart point to a possible bullish reversal in the short term. Zooming out, the buyers must make a stride to reclaim the 200-day SMA at 0.6070 to avoid additional losses.


NZD/USD

Overview
Today last price 0.6004
Today Daily Change 0.0000
Today Daily Change % 0.00
Today daily open 0.6004
 
Trends
Daily SMA20 0.6096
Daily SMA50 0.6111
Daily SMA100 0.6135
Daily SMA200 0.6075
 
Levels
Previous Daily High 0.6032
Previous Daily Low 0.5995
Previous Weekly High 0.6107
Previous Weekly Low 0.5989
Previous Monthly High 0.6219
Previous Monthly Low 0.6037
Daily Fibonacci 38.2% 0.6018
Daily Fibonacci 61.8% 0.6009
Daily Pivot Point S1 0.5989
Daily Pivot Point S2 0.5973
Daily Pivot Point S3 0.5952
Daily Pivot Point R1 0.6026
Daily Pivot Point R2 0.6047
Daily Pivot Point R3 0.6063


Disclaimer: For information purposes only. Past performance is not indicative of future results.
placeholder
2025 Black Friday is coming! Which stocks may see volatility?Coming on the day right after Thanksgiving in the United States, Back Friday marks the start of the holiday shopping season. Sales data from this shopping frenzy day reflects investor confidence and consumer trends. The National Retail Federation (NRF) predicts that holiday season (Nov and Dec) retail sales in 2025 will likely exceed $1 trillion for the very first time, which represents a year-over-year increase of 3.7 to 4.2 percent. Historic data from the past decade show that the retail sector has generally outperformed the S&P 500 during the weeks before and after Black Friday. The following retailing companies are expected to be big winners:
Author  Insights
Nov 24, Mon
Coming on the day right after Thanksgiving in the United States, Back Friday marks the start of the holiday shopping season. Sales data from this shopping frenzy day reflects investor confidence and consumer trends. The National Retail Federation (NRF) predicts that holiday season (Nov and Dec) retail sales in 2025 will likely exceed $1 trillion for the very first time, which represents a year-over-year increase of 3.7 to 4.2 percent. Historic data from the past decade show that the retail sector has generally outperformed the S&P 500 during the weeks before and after Black Friday. The following retailing companies are expected to be big winners:
placeholder
Bitcoin Price Rebound Gains Traction with $90K Break in SightBitcoin is trading above $87,000 and its 100-hour SMA after rebounding from $83,500, with a bearish trend line at $88,200 and resistance at $89,000–$90,000 now in focus as BTC either breaks higher toward $91,750–$94,000 or slips back toward $86,700, $85,000 and lower supports.
Author  Mitrade
Nov 26, Wed
Bitcoin is trading above $87,000 and its 100-hour SMA after rebounding from $83,500, with a bearish trend line at $88,200 and resistance at $89,000–$90,000 now in focus as BTC either breaks higher toward $91,750–$94,000 or slips back toward $86,700, $85,000 and lower supports.
placeholder
Bitcoin Targets $89K Breakout as S&P 500 Nears ATH on Fed Rate Cut HopesBitcoin price action shows signs of a potential short squeeze as it hovers near $88,000, with analysts watching liquidity dynamics that could push it toward $89,000 or retrace to $85,000.
Author  Mitrade
Yesterday 03: 31
Bitcoin price action shows signs of a potential short squeeze as it hovers near $88,000, with analysts watching liquidity dynamics that could push it toward $89,000 or retrace to $85,000.
placeholder
Ethereum Reclaims $3K Handle—Is a Breakout Imminent?Ethereum has jumped back above $3,000 and reclaimed key Fib levels, with a bullish trend line at $2,880 and strong MACD/RSI readings putting a breakout above $3,120–$3,165 — and a possible run toward $3,320–$3,350 — on the table, as long as support around $2,980–$2,920 holds.
Author  Mitrade
Yesterday 03: 42
Ethereum has jumped back above $3,000 and reclaimed key Fib levels, with a bullish trend line at $2,880 and strong MACD/RSI readings putting a breakout above $3,120–$3,165 — and a possible run toward $3,320–$3,350 — on the table, as long as support around $2,980–$2,920 holds.
placeholder
Bitcoin Price Forecast: BTC extends recovery as ETF records positive flows Bitcoin (BTC) price continues to trade in green above $91,500 at the time of writing on Thursday after rebounding from the key support level.
Author  FXStreet
18 hours ago
Bitcoin (BTC) price continues to trade in green above $91,500 at the time of writing on Thursday after rebounding from the key support level.
goTop
quote