GBP/USD Price Analysis: Could test the level of 1.2600, next support at March’s low

Source Fxstreet
  • GBP/USD could break the psychological support of the 1.2600 level to revisit March’s low at 1.2575.
  • Technical analysis suggests the bearish sentiment to test the major support of the 1.2550 level.
  • The resistance zone could be found around the 23.6% Fibonacci retracement level of 1.2650 level and the nine-day EMA at 1.2668.

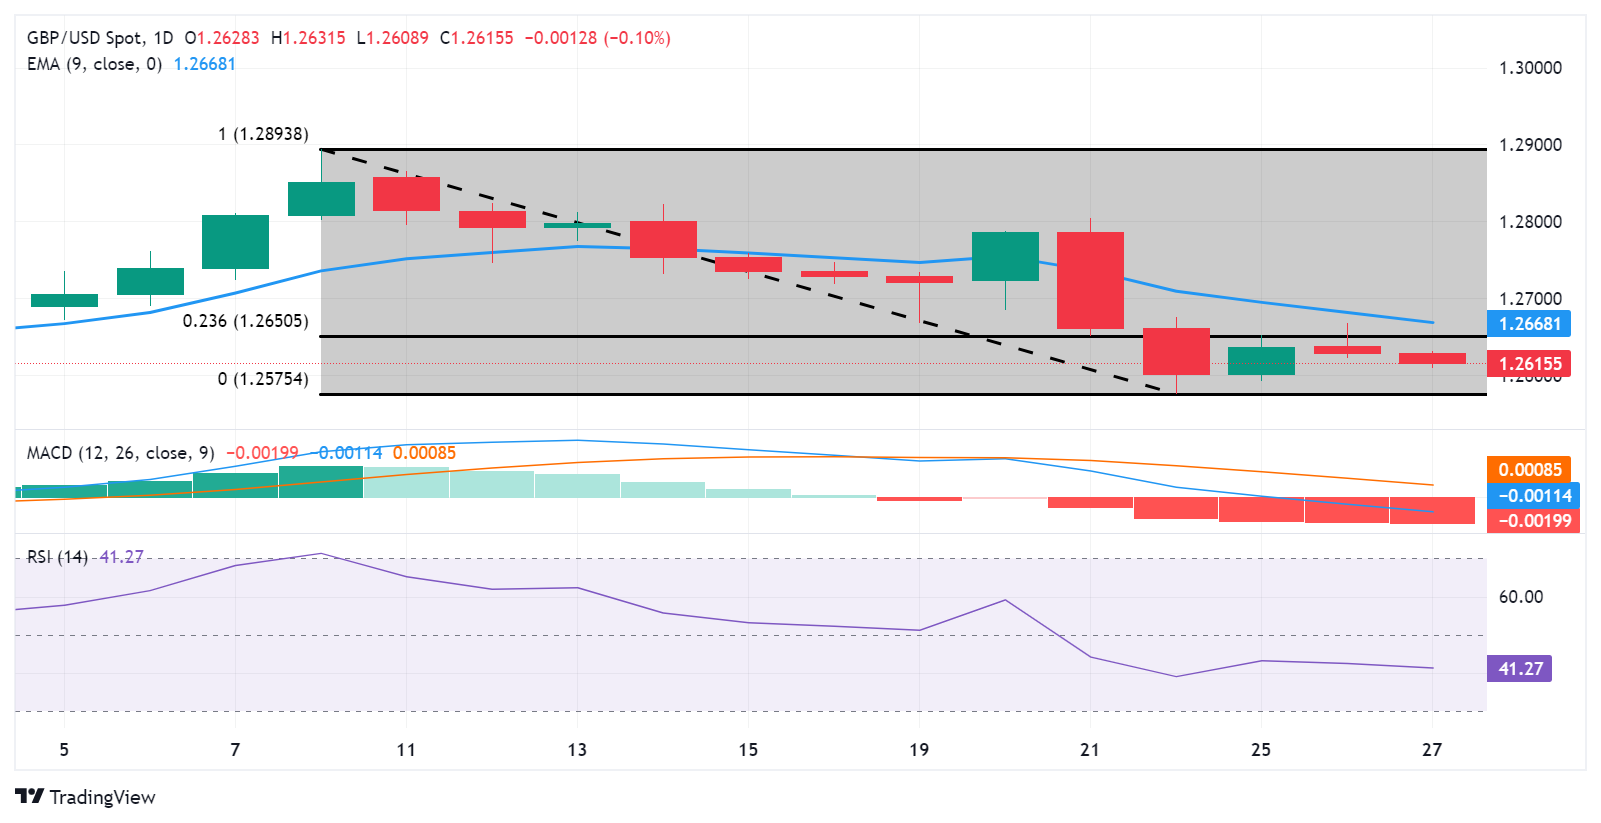
GBP/USD extends its losses for the second consecutive day, depreciating to near 1.2620 during the Asian session on Wednesday. The pair could test the psychological support level of 1.2600. If this level is breached, it could prompt the pair to revisit March’s low at 1.2575.

The technical analysis of the GBP/USD pair suggests a bearish trend. The 14-day Relative Strength Index (RSI) is positioned below 50, indicating a bearish sentiment. Additionally, the Moving Average Convergence Divergence (MACD) confirms the bearish trend, as the MACD line is below the centerline and exhibits divergence below the signal line.

The bearish sentiment could influence the GBP/USD pair to test the major support of 1.2550 level, followed by February’s low of 1.2518.

On the upside, the GBP/USD pair could meet the major barrier at 23.6% Fibonacci retracement level of 1.2650 level. A breakthrough above this barrier could exert upward support for the pair to test the nine-day Exponential Moving Average (EMA) at 1.2668.

If the GBP/USD pair surpasses the latter, it could approach the psychological level of 1.2700.

GBP/USD: Daily Chart
GBP/USD

Overview
Today last price 1.2617
Today Daily Change -0.0011
Today Daily Change % -0.09
Today daily open 1.2628
 
Trends
Daily SMA20 1.272
Daily SMA50 1.268
Daily SMA100 1.2645
Daily SMA200 1.2591
 
Levels
Previous Daily High 1.2668
Previous Daily Low 1.2622
Previous Weekly High 1.2804
Previous Weekly Low 1.2575
Previous Monthly High 1.2773
Previous Monthly Low 1.2518
Daily Fibonacci 38.2% 1.264
Daily Fibonacci 61.8% 1.2651
Daily Pivot Point S1 1.2611
Daily Pivot Point S2 1.2594
Daily Pivot Point S3 1.2565
Daily Pivot Point R1 1.2657
Daily Pivot Point R2 1.2686
Daily Pivot Point R3 1.2703


Disclaimer: For information purposes only. Past performance is not indicative of future results.
placeholder
Gold Price Forecast: XAU/USD recovers above $4,100, hawkish Fed might cap gainsGold price (XAU/USD) recovers some lost ground to near $4,105, snapping the two-day losing streak during the early European session on Friday. The precious metal edges higher on the softer US Dollar (USD).  Traders will take more cues from the Fedspeak later on Monday.
Author  FXStreet
Nov 17, Mon
Gold price (XAU/USD) recovers some lost ground to near $4,105, snapping the two-day losing streak during the early European session on Friday. The precious metal edges higher on the softer US Dollar (USD).  Traders will take more cues from the Fedspeak later on Monday.
placeholder
Ethereum Edges Toward Long-Term Holders’ Cost Basis, Now Only 8% Above Key Accumulation LevelEthereum is trading near $3,150 and just 8% above a key $2,895 long-term holders’ cost basis, with on-chain flows, macro uncertainty and support around $3,000–$2,800 all shaping what comes next for ETH.
Author  Mitrade
Nov 18, Tue
Ethereum is trading near $3,150 and just 8% above a key $2,895 long-term holders’ cost basis, with on-chain flows, macro uncertainty and support around $3,000–$2,800 all shaping what comes next for ETH.
placeholder
Ethereum Dips Below $3,000: Is the Bull Market at an End?Ethereum's price plunged below $3,000 for the first time in four months, marking growing concerns of a potential end to the bull market.
Author  Mitrade
Nov 18, Tue
Ethereum's price plunged below $3,000 for the first time in four months, marking growing concerns of a potential end to the bull market.
placeholder
Bitcoin Falls Below $90K: BitMine & Bitwise Executives Predict Market Bottom This Week​Bitcoin's recent drop below $90,000 may signal a market bottom, according to industry leaders.
Author  Mitrade
21 hours ago
​Bitcoin's recent drop below $90,000 may signal a market bottom, according to industry leaders.
placeholder
Top 3 Price Prediction: Bitcoin, Ethereum, Ripple – BTC, ETH and XRP Look for a Foothold After a Sharp ShakeoutBitcoin trades near $92,600 after a dip below $90,000, while Ethereum around $3,118 and XRP near $2.21–$2.23 sit on key support zones, as BTC, ETH and XRP all try to turn a sharp correction into a tradable rebound rather than a deeper slide.
Author  Mitrade
20 hours ago
Bitcoin trades near $92,600 after a dip below $90,000, while Ethereum around $3,118 and XRP near $2.21–$2.23 sit on key support zones, as BTC, ETH and XRP all try to turn a sharp correction into a tradable rebound rather than a deeper slide.
goTop
quote