


EUR/GBP Price Forecast: Approaching key support at 0.8600
- Euro upside attempts find sellers, and the pair turns lower, approaching the 0.8600 area
- Uncertainty about the outcome of the Trump-Zelenskyy meeting is weighing on the Euro.
- A confirmation below 0.8595 would activate a double and signal a trend shift.
The Euro recovery attempt against the British Pound has been short-lived. Bulls have been halted at 0.8640 on Monday’s early trading, and the pair retreats to 0.8625, keeping the immediate bearish tone intact and drawing closer to a key support area at 0.8600.
In the absence of key macroeconomic releases, the Euro remains on its back foot ahead of the Trump-Zelenskyy meeting in Washington. The Pound, on the other hand, maintains a moderately bullish tone as recent data endorses the BoE’s growing hawkish party, pointing to steady interest rates in the coming months..
Technical Analysis: Potential double top at 0.8740-0.8750
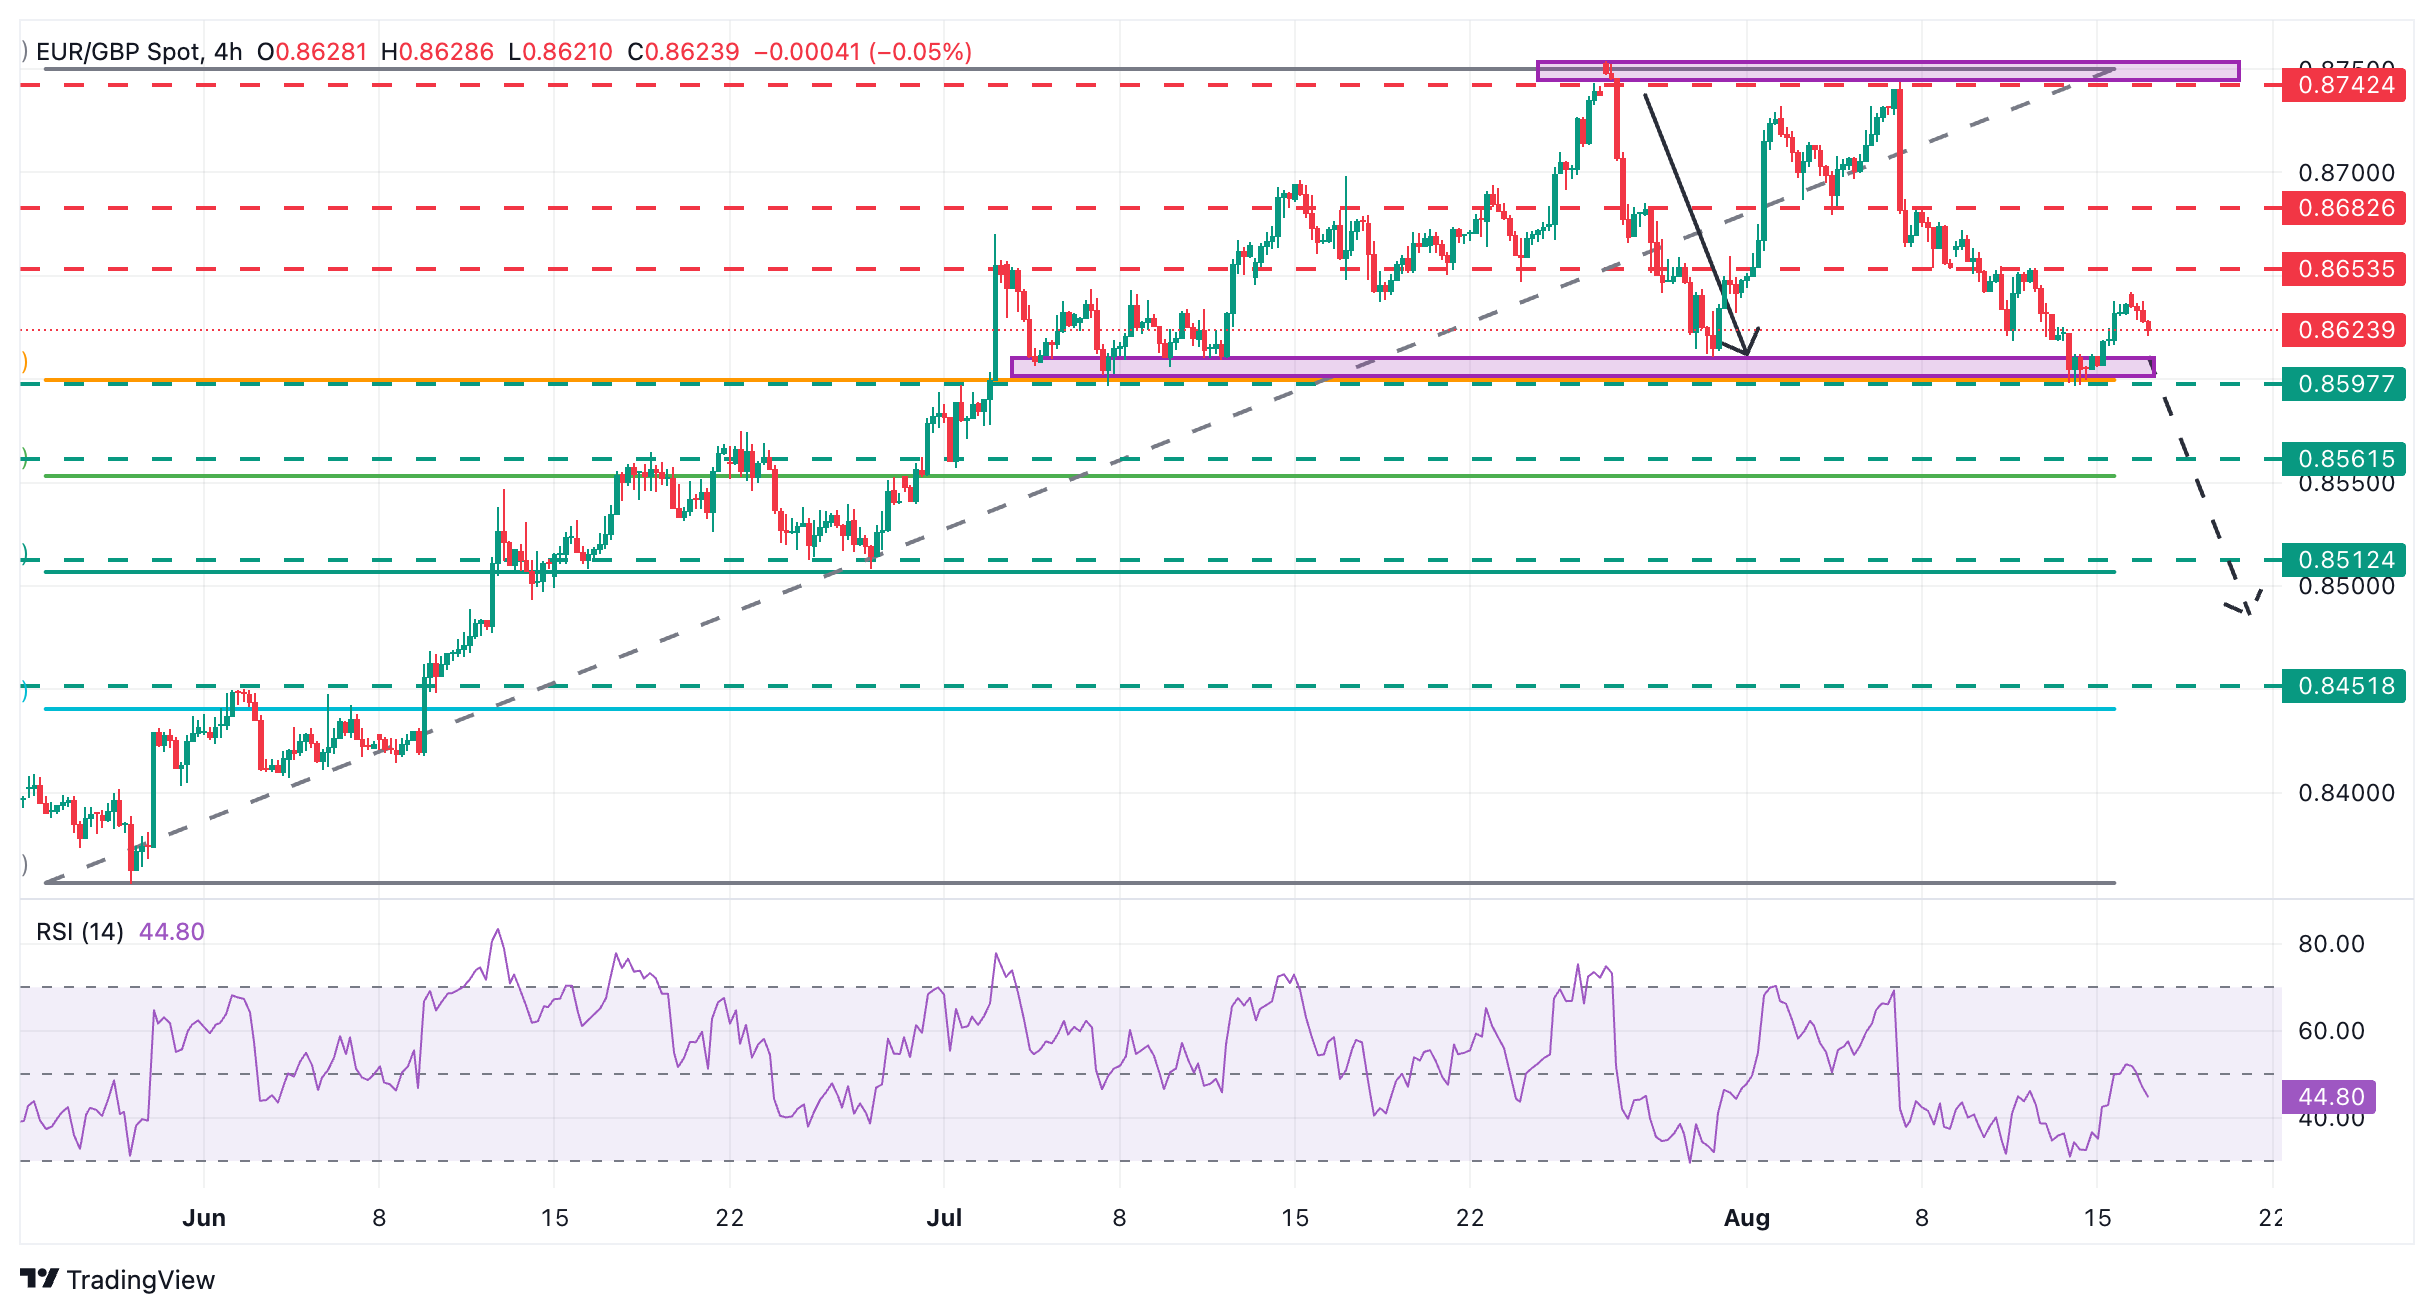
A look at the 4-hour charts shows the EUR/GBP heading lower and approaching the support area between 0.8600 and 0.8610, the bottom of the last two months' trading range and the neckline of a Double Top pattern at August 25 and Juñly 7 lows, at the 0.8740-0.8750 area.
The Double-top figure would be confirmed on a successful move below the July 7 and August 15 lows, at 0.8595. Further down, the 0.8560-0.8570 area (June 23 highs-July 1 lows) might provide some support ahead of the DT’s measured target, near the 0.8500 level
To the upside, the pair needs to extend gains beyond the August 12 high of 0.8655 to ease bearish pressure and shift the focus towards the August 5 low, at 0.8680, ahead of the mentioned highs at 0.8750.
Euro PRICE Today
The table below shows the percentage change of Euro (EUR) against listed major currencies today. Euro was the strongest against the Swiss Franc.
| USD | EUR | GBP | JPY | CAD | AUD | NZD | CHF | |
|---|---|---|---|---|---|---|---|---|
| USD | 0.28% | 0.06% | 0.15% | -0.15% | -0.09% | -0.24% | 0.22% | |
| EUR | -0.28% | -0.21% | -0.14% | -0.43% | -0.36% | -0.55% | -0.05% | |
| GBP | -0.06% | 0.21% | -0.04% | -0.22% | -0.15% | -0.33% | 0.12% | |
| JPY | -0.15% | 0.14% | 0.04% | -0.28% | -0.22% | -0.37% | 0.07% | |
| CAD | 0.15% | 0.43% | 0.22% | 0.28% | 0.04% | -0.09% | 0.34% | |
| AUD | 0.09% | 0.36% | 0.15% | 0.22% | -0.04% | -0.19% | 0.24% | |
| NZD | 0.24% | 0.55% | 0.33% | 0.37% | 0.09% | 0.19% | 0.43% | |
| CHF | -0.22% | 0.05% | -0.12% | -0.07% | -0.34% | -0.24% | -0.43% |
The heat map shows percentage changes of major currencies against each other. The base currency is picked from the left column, while the quote currency is picked from the top row. For example, if you pick the Euro from the left column and move along the horizontal line to the US Dollar, the percentage change displayed in the box will represent EUR (base)/USD (quote).
Recommended Articles


