GBP/USD climbs after FOMC hold rates, revise long-term projections

Source Fxstreet
  • GBP/USD sees a significant uptick, navigating the 1.2700/1.2750 range following the Federal Reserve's rate decision.
  • Fed holds interest rates steady, with an emphasis on the ongoing strength of the US economy and labor market.
  • Despite high recent inflation, Fed's projections for 2024 remain stable; slight adjustment made for 2025 FFR outlook.

The GBP/USD climbed sharply after the Federal Reserve’s (Fed) decision to hold rates but kept their interest rate cut projections unchanged for 2024. Consequently, the Greenback tumbled, while US Treasury bond yields climbed. At the time of writing, the GBP/USD trades volatile in the 1.2700/1.2750 area ahead of Fed Chair Jerome Powell's press conference.

Summary of the Fed’s monetary policy statement

The US Federal Reserve has decided to keep interest rates steady at 5.25%-5.50% and continue reducing its balance sheet at an ongoing pace since May 2023. In their announcement, Federal Reserve officials highlighted the strength of the US economy and the robustness of the labor market. While progress on inflation has been acknowledged, they cautioned that the effort to stabilize prices is not yet finished. They noted an improved balance in the risks associated with achieving the Fed's dual mandate of maximum employment and stable prices, affirming their commitment to data-driven decision-making.

Following two consecutive months of unexpectedly high inflation data, the Federal Reserve adjusted its monetary policy outlook for 2025. Although the median forecast for 2024 remains unchanged at 4.6% from December's projection, the forecast for the Federal Funds Rate (FFR) for 2025 was revised upwards from 3.6% to 3.9%. Other economic indicators were also updated in their statement.

  • The Gross Domestic Product (GDP) for 2024 was revised to 2.1%, up from 1.4% in December.
  • The Unemployment Rate was revised downward, expected to fall to 4.0%, from 4.1%.
  • The Personal Consumption Expenditure (PCE) Price Index target wasn’t changed, remaining at 2.4%, while core PCE is estimated to end 2024 at 2.6%, up from 2.4%.

Following the release of the data, the yield on the US 10-year Treasury note decreased by two basis points to 4.275%. Concurrently, the US Dollar is experiencing downward pressure.

GBP/USD Price Action – Hourly Chart

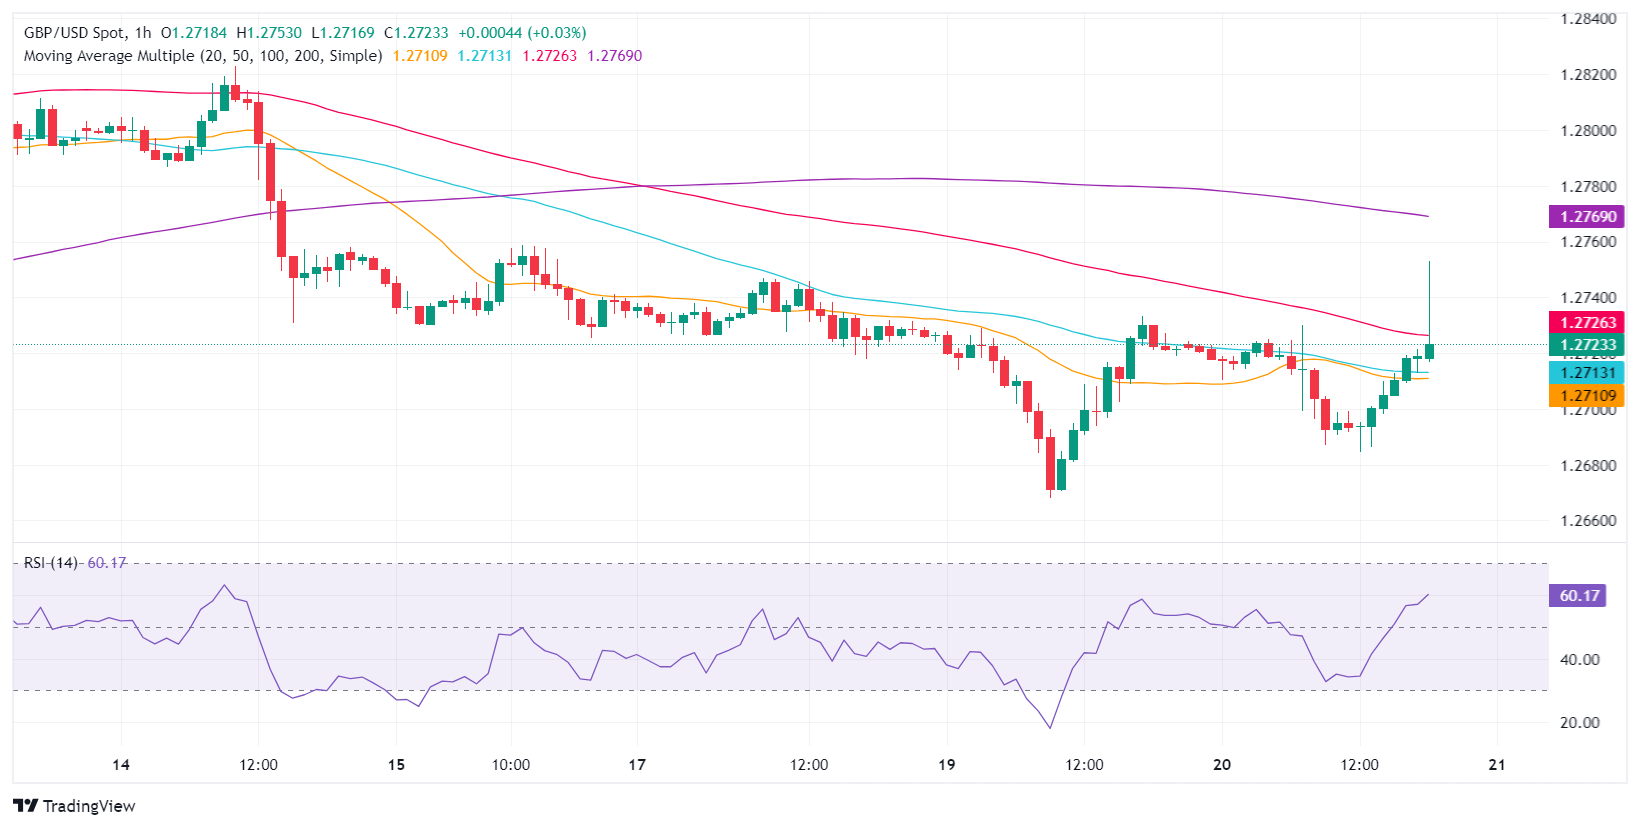
The GBP/USD surged towards a daily high of 1.2752, but since then, the pair has retreated towards the 100-moving average (SMA) at around 1.2725. As the Fed Chair Jerome Powell press conference looms, the major could re-test daily highs on dovish remarks, and that could expose the 1.2800 mark. A breach of the latter will expose the March 14 high of 1.2823, followed by the March 8 high at 1.2894. on the flip side, the pair could edge towards the 50-SMA at 1.2713, ahead of the 1.2700 mark. Further downside is seen at the March 19 low of 1.2667.

GBP/USD

Overview
Today last price 1.2737
Today Daily Change 0.0016
Today Daily Change % 0.13
Today daily open 1.2721
 
Trends
Daily SMA20 1.272
Daily SMA50 1.2686
Daily SMA100 1.2626
Daily SMA200 1.2594
 
Levels
Previous Daily High 1.2733
Previous Daily Low 1.2668
Previous Weekly High 1.2865
Previous Weekly Low 1.2725
Previous Monthly High 1.2773
Previous Monthly Low 1.2518
Daily Fibonacci 38.2% 1.2693
Daily Fibonacci 61.8% 1.2708
Daily Pivot Point S1 1.2682
Daily Pivot Point S2 1.2642
Daily Pivot Point S3 1.2616
Daily Pivot Point R1 1.2747
Daily Pivot Point R2 1.2773
Daily Pivot Point R3 1.2813


Disclaimer: For information purposes only. Past performance is not indicative of future results.
placeholder
U.S. November Nonfarm Payrolls: What Does the Rare "Weak Jobs, Strong Economy" Mix Mean for U.S. Equities?1. IntroductionAfter retreating from the late-October highs, U.S. equities embarked on a bottoming rebound in mid-to-late November, a trend driven by the interplay of multiple factors. That said, it i
Author  TradingKey
6 hours ago
1. IntroductionAfter retreating from the late-October highs, U.S. equities embarked on a bottoming rebound in mid-to-late November, a trend driven by the interplay of multiple factors. That said, it i
placeholder
Senate Delays Crypto Market Structure Hearings to Early 2026The Senate Banking Committee has postponed cryptocurrency market structure hearings until 2026, citing ongoing bipartisan negotiations.
Author  Mitrade
11 hours ago
The Senate Banking Committee has postponed cryptocurrency market structure hearings until 2026, citing ongoing bipartisan negotiations.
placeholder
Bitcoin Slides 5% as Sellers Lean In — Can BTC Reclaim $88,000?Bitcoin has dropped back below $88,000 after rolling over from $90,500, with price still trading under the 100-hour Simple Moving Average. The sell-off found a floor at $85,151, and BTC is now consolidating near that base, but rebounds are facing pressure from a bearish trend line around $89,000. Bulls need to retake $88,000–$89,000 to ease downside risk; failure to do so keeps $85,500–$85,000 and then $83,500 in play, with $80,000 as the deeper “line in the sand.” Bitcoin (BTC) is back in damage-control mode after a sharp pullback wiped out recent gains. The price failed to reclaim the $90,000–$90,500 band, rolled over, and slid through $88,500 before briefly dipping under $87,000. Buyers did show up around $85,000, but the rebound so far looks more like stabilization than a clear trend reversal. Bitcoin dips hard, finds a bid near $85,000(h3) BTC’s latest move lower began when it couldn’t build follow-through above $90,000 and $90,500. Once that upside stalled, sellers took control and pushed price down through $88,500. The slide accelerated enough to spike below $87,000, but the market didn’t free-fall. Bulls defended the $85,000 zone, printing a low at $85,151. Since then, Bitcoin has been consolidating below the 23.6% Fibonacci retracement of the drop from the $93,560 swing high to the $85,151 low — a clue that the bounce is still shallow and that sellers haven’t fully backed off yet. Structurally, BTC is still on the back foot: It’s trading below $88,000, and It remains below the 100-hour Simple Moving Average, keeping short-term trend pressure pointed downward. Resistance is layered, and $89,000 is the problem area(h3) If bulls try to turn this into a recovery, they’ll have to climb through multiple ceilings in quick succession. First, BTC faces resistance around $87,150, followed by a more meaningful barrier near $87,500. From there, the market’s attention snaps back to $88,000 — the level BTC just lost and now needs to reclaim. A close back above $88,000 would improve the tone, but it doesn’t solve the bigger issue: there’s a bearish trend line on the hourly BTC/USD chart (Kraken feed) with resistance near $89,000, which also lines up with the next technical hurdle. If BTC can push through $89,000 and hold, the rebound could extend toward $90,000, with follow-through targets at $91,000 and $91,500. But until price clears that $88,000–$89,000 zone, rallies are at risk of being sold rather than chased. If BTC fails to reclaim resistance, the downside path is clear(h3) The near-term bear case is simple: if Bitcoin can’t climb back above the $87,000 area and keep traction, sellers may attempt another leg lower. Support levels line up like this: Immediate support: $85,500 First major support: $85,000 Next support: $83,500 Then $82,500 in the near term Below that, the major “don’t break this” level is still $80,000. If BTC slips under $80,000, the risk of acceleration to the downside increases significantly — not because it’s magic, but because it’s the kind of psychological and structural level that tends to trigger forced de-risking. Indicators: momentum still leans bearish(h3) The intraday indicators aren’t offering much comfort yet: Hourly MACD is losing pace in the bearish zone. Hourly RSI remains below 50, suggesting sellers still have the upper hand on short timeframes. So while the $85,000 defense held for now, the market hasn’t flipped bullish — it’s just stopped bleeding.
Author  Mitrade
14 hours ago
Bitcoin has dropped back below $88,000 after rolling over from $90,500, with price still trading under the 100-hour Simple Moving Average. The sell-off found a floor at $85,151, and BTC is now consolidating near that base, but rebounds are facing pressure from a bearish trend line around $89,000. Bulls need to retake $88,000–$89,000 to ease downside risk; failure to do so keeps $85,500–$85,000 and then $83,500 in play, with $80,000 as the deeper “line in the sand.” Bitcoin (BTC) is back in damage-control mode after a sharp pullback wiped out recent gains. The price failed to reclaim the $90,000–$90,500 band, rolled over, and slid through $88,500 before briefly dipping under $87,000. Buyers did show up around $85,000, but the rebound so far looks more like stabilization than a clear trend reversal. Bitcoin dips hard, finds a bid near $85,000(h3) BTC’s latest move lower began when it couldn’t build follow-through above $90,000 and $90,500. Once that upside stalled, sellers took control and pushed price down through $88,500. The slide accelerated enough to spike below $87,000, but the market didn’t free-fall. Bulls defended the $85,000 zone, printing a low at $85,151. Since then, Bitcoin has been consolidating below the 23.6% Fibonacci retracement of the drop from the $93,560 swing high to the $85,151 low — a clue that the bounce is still shallow and that sellers haven’t fully backed off yet. Structurally, BTC is still on the back foot: It’s trading below $88,000, and It remains below the 100-hour Simple Moving Average, keeping short-term trend pressure pointed downward. Resistance is layered, and $89,000 is the problem area(h3) If bulls try to turn this into a recovery, they’ll have to climb through multiple ceilings in quick succession. First, BTC faces resistance around $87,150, followed by a more meaningful barrier near $87,500. From there, the market’s attention snaps back to $88,000 — the level BTC just lost and now needs to reclaim. A close back above $88,000 would improve the tone, but it doesn’t solve the bigger issue: there’s a bearish trend line on the hourly BTC/USD chart (Kraken feed) with resistance near $89,000, which also lines up with the next technical hurdle. If BTC can push through $89,000 and hold, the rebound could extend toward $90,000, with follow-through targets at $91,000 and $91,500. But until price clears that $88,000–$89,000 zone, rallies are at risk of being sold rather than chased. If BTC fails to reclaim resistance, the downside path is clear(h3) The near-term bear case is simple: if Bitcoin can’t climb back above the $87,000 area and keep traction, sellers may attempt another leg lower. Support levels line up like this: Immediate support: $85,500 First major support: $85,000 Next support: $83,500 Then $82,500 in the near term Below that, the major “don’t break this” level is still $80,000. If BTC slips under $80,000, the risk of acceleration to the downside increases significantly — not because it’s magic, but because it’s the kind of psychological and structural level that tends to trigger forced de-risking. Indicators: momentum still leans bearish(h3) The intraday indicators aren’t offering much comfort yet: Hourly MACD is losing pace in the bearish zone. Hourly RSI remains below 50, suggesting sellers still have the upper hand on short timeframes. So while the $85,000 defense held for now, the market hasn’t flipped bullish — it’s just stopped bleeding.
placeholder
AUD/USD remains depressed below mid-0.6600s; downside seems limited ahead of US NFP reportThe AUD/USD pair attracts some sellers for the fourth straight day on Tuesday and trades around the 0.6630 region, down just over 0.10%, during the Asian session.
Author  FXStreet
15 hours ago
The AUD/USD pair attracts some sellers for the fourth straight day on Tuesday and trades around the 0.6630 region, down just over 0.10%, during the Asian session.
placeholder
Macro Analysts: Hawkish Japan Could Push Bitcoin Below $70KAnalysts predict Bitcoin may face further declines towards the $70,000 mark if the Bank of Japan raises interest rates as expected.
Author  Mitrade
Yesterday 05: 48
Analysts predict Bitcoin may face further declines towards the $70,000 mark if the Bank of Japan raises interest rates as expected.
goTop
quote