


Equinor ASA Stock (EQNR) Moved Up by 3.27% on Sep 1: Key Drivers Unveiled
Equinor ASA (EQNR) moved up by 3.27%. The Energy - Fossil Fuels sector is up by 1.75%. The company outperformed the industry. Top 3 stocks by turnover in the sector: Chevron Corp (CVX) up 1.93%; Schlumberger NV (SLB) down 3.79%; Exxon Mobil Corp (XOM) up 2.19%.
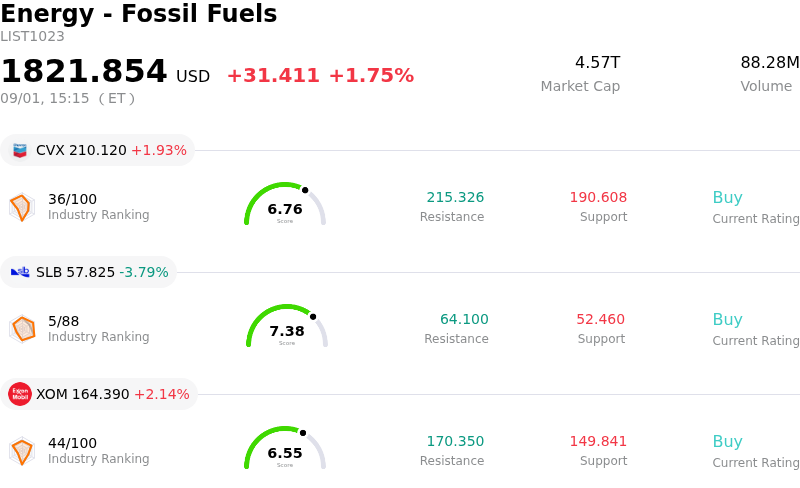
What is driving Equinor ASA (EQNR)’s stock price up today?
Equinor experienced notable upward momentum alongside intraday trading volatility, primarily propelled by a sharp surge in global crude oil and natural gas benchmarks. Geopolitical friction and military activity surrounding critical maritime routes in the Middle East sparked heightened supply risk premiums, driving energy prices substantially higher. As Europe's primary pipeline gas supplier and a premier integrated energy major, Equinor stands as a primary beneficiary of elevated commodity prices, which directly enhance cash flow generation and operating margins.
Beyond the favorable macroeconomic backdrop, company-specific operational execution supported investor sentiment. The early startup of the Troll Phase 3 stage 2 subsea project strengthened Equinor’s gas supply capacity to European markets at lower-than-projected capital expenditures. Additionally, recent strategic commercial wins, including a major long-term gas supply contract with Uniper and crude delivery agreements with regional refiners, reinforce Equinor's competitive positioning and secure long-term revenue visibility across its continental European footprint.
Capital return initiatives also provided fundamental support during intraday trading. Equinor’s steady execution of the third tranche of its annual share buyback program continues to reduce share count while providing a persistent source of institutional buying. While broader equity markets experienced turbulence from rising interest rate yields and inflationary pressures, energy equities like Equinor attracted rotated capital seeking defensive exposure and cash distribution strength. Despite short-term price swings reflecting broader market anxiety, the combination of elevated energy prices and disciplined corporate execution drove positive price movement for the session.
Technical Analysis of Equinor ASA (EQNR)
Technically, Equinor ASA (EQNR) shows a MACD (12,26,9) value of 0.010, indicating a buy signal. The RSI at 69.347 suggests neutral condition and the Williams %R at 0.000 suggests overbought condition. Please monitor closely.
Fundamental Analysis of Equinor ASA (EQNR)
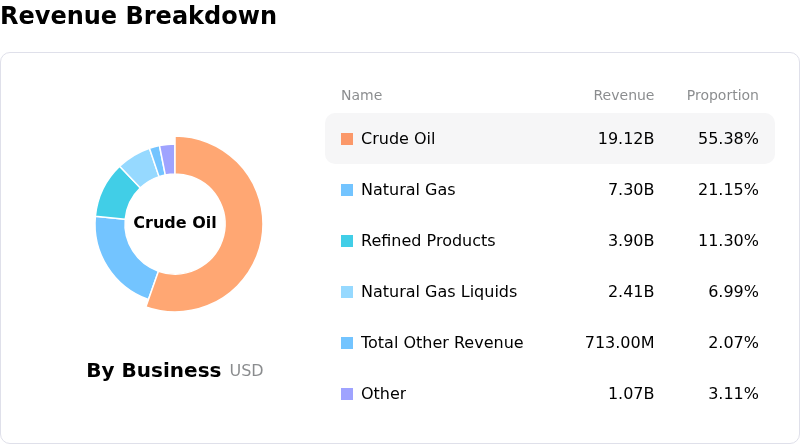
Equinor ASA (EQNR) is in the Energy - Fossil Fuels industry. Its latest annual revenue is $105.83B, ranking 9 in the industry. The net profit is $5.04B, ranking 9 in the industry. Company Profile
Over the past month, multiple analysts have rated the company as Hold, with an average price target of $35.89, a high of $39.88, and a low of $31.25.
More details about Equinor ASA (EQNR)
Company Specific Risks:
- Analyst Downgrades and Fair Valuation Ceiling: Following a significant year-to-date rally pushing shares to record highs near $43.48, Wall Street firms including Gerdes Energy Research have downgraded EQNR from Buy to Neutral, signaling that current price levels fully reflect immediate catalysts and offer restricted upside.
- Operational Downtime and Field Yield Trajectory: Operational disruptions, such as an 18-day turbine-related outage at the key Johan Castberg offshore field that cuts Q3 2026 net production by approximately 14,000 barrels per day, accentuate near-term volume risks alongside structural natural declines at the flagship Johan Sverdrup field.
- Capital Allocation Friction and Regulatory Delays in Renewables: Strategic capital repositioning—marked by a $4 billion CapEx scale-back in low-carbon assets alongside a $940 million gas-plant acquisition—exposes the firm to project execution hurdles and persistent regulatory uncertainties in U.S. offshore projects such as Empire Wind.
- Commodity Price Exposure and Cash Flow Volatility: Forecasts pointing to a retreat in Brent crude prices from Q2 highs of over $100 per barrel down toward $70 per barrel in late 2026 threaten to compress realized margins and free cash flow generation, which could strain the long-term flexibility of expanded capital return targets.
Recommended Articles


