


Goldman Sachs Group Inc Stock (GS) Moved Down by 3.38% on Jul 16: A Full Analysis
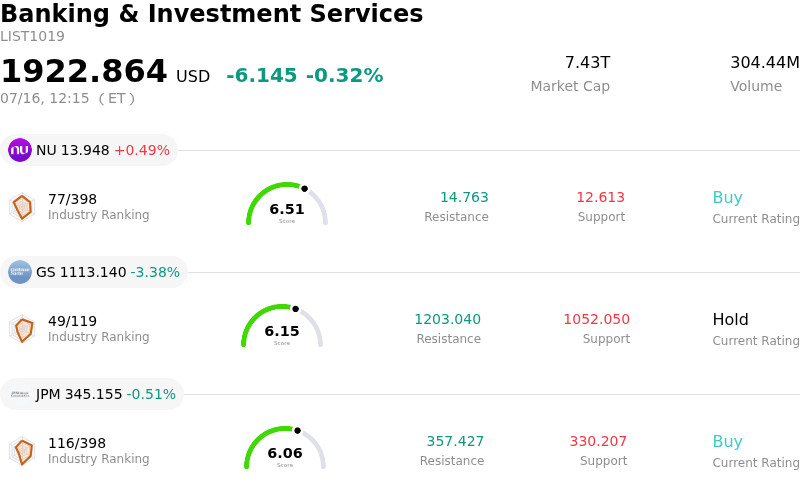
Goldman Sachs Group Inc (GS) moved down by 3.38%. The Banking & Investment Services sector is down by 0.32%. The company underperformed the industry. Top 3 stocks by turnover in the sector: Nu Holdings Ltd (NU) up 0.49%; Goldman Sachs Group Inc (GS) down 3.38%; JPMorgan Chase & Co (JPM) down 0.51%.
What is driving Goldman Sachs Group Inc (GS)’s stock price down today?
Goldman Sachs is experiencing notable downward pressure as broader market sentiment shifts amid evolving macroeconomic signals. A primary driver appears to be the recent recalibration of interest rate expectations by the Federal Reserve. As the market digests new inflation data, concerns over a potential slowdown in economic activity are weighing heavily on the financial sector. For a firm like Goldman, which is deeply integrated into global capital markets, any signal of a cooling economy directly impacts expectations for future deal flow and advisory services.
The investment banking division, a core pillar of the company’s revenue stream, is facing headwinds from a stagnant merger and acquisition environment. Despite some earlier signs of a recovery in the IPO market, institutional investors remain cautious. Management’s recent commentary regarding the pace of deal closures has likely fueled skepticism about the sustainability of revenue growth in the short term. Furthermore, the volatility in the fixed income and equity trading desks suggests that while volumes are high, the margins and directional bets may not be yielding the outsized returns seen in previous quarters.
Internal operational risks and regulatory oversight also contribute to the current volatility. Reports suggesting tighter capital requirement mandates or increased scrutiny over the firm’s consumer-facing legacy assets continue to create a cloud of uncertainty. As the banking industry navigates a period of transition, Goldman’s strategic pivot back to its core strengths in institutional banking and wealth management is being tested by intensified competition from both traditional peers and aggressive boutique firms.
From a technical perspective, the breach of key support levels has triggered automated selling programs, exacerbating the intraday decline. Institutional portfolio adjustments are evident as hedge funds and large asset managers rebalance their exposure to the financial sector in response to shifting yield curve dynamics. The combination of macro-level uncertainty, a cautious outlook on investment banking fees, and regulatory headwinds has created a challenging environment for the stock, leading to the current retreat in valuation.
Technical Analysis of Goldman Sachs Group Inc (GS)
Technically, Goldman Sachs Group Inc (GS) shows a MACD (12,26,9) value of 14.800, indicating a buy signal. The RSI at 68.870 suggests neutral condition and the Williams %R at 1.272 suggests overbought condition. Please monitor closely.
Media Coverage of Goldman Sachs Group Inc (GS)
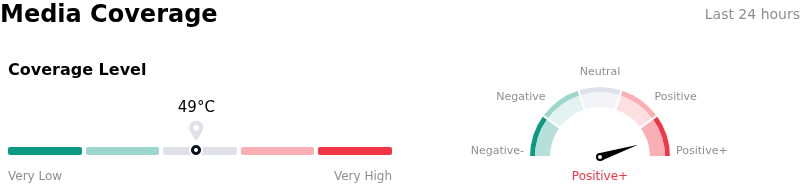
In terms of media coverage, Goldman Sachs Group Inc (GS) shows a coverage score of 49, indicating a moderate level of media attention. The overall market sentiment index is currently in extremely bullish zone.
Fundamental Analysis of Goldman Sachs Group Inc (GS)
Goldman Sachs Group Inc (GS) is in the Banking & Investment Services industry. Its latest annual revenue is $117.10B, ranking 2 in the industry. The net profit is $16.30B, ranking 1 in the industry. Company Profile
Over the past month, multiple analysts have rated the company as Hold, with an average price target of $1097.11, a high of $1325.00, and a low of $834.00.
More details about Goldman Sachs Group Inc (GS)
Company Specific Risks:
- Valuation and "Peak Earnings" Sentiment: Following the Q2 2026 earnings release, institutional analysts have highlighted "frothy" valuation metrics, including a price-to-tangible book value of 3.1x, leading to "Sell" downgrades on the premise that the current outperformance represents a cyclical peak for the firm.
- Macro-Geopolitical Sensitivity: The recent declaration that the Middle East ceasefire has collapsed has triggered a global "risk-off" rotation that disproportionately pressures capital-markets-sensitive stocks like GS, as heightened geopolitical uncertainty threatens to stall the recovery in global M&A and dealmaking.
- AI Underwriting Growth Recalibration: Management’s July 14th commentary regarding the "harder and slower" than expected enterprise deployment of AI has introduced significant uncertainty regarding the sustainability of the bank's massive investment banking fees derived from the current AI-led IPO boom.
- Technical Momentum Exhaustion: Trading data from the last 48 hours reveals a bearish RSI divergence and a failure to maintain support levels at all-time highs, signaling a technical breakdown and potential for a sharp mean-reversion decline as institutional investors lock in profits.
Recommended Articles


