
US Dollar Index Price Forecast: Remains under pressure near 98.00, oversold RSI condition eyed

The US Dollar Index extends the decline to around 98.15 in Tuesday’s early European session, down 0.17% on the day.
The negative outlook of the index remains in play, but further consolidation cannot be ruled out amid the oversold RSI condition.
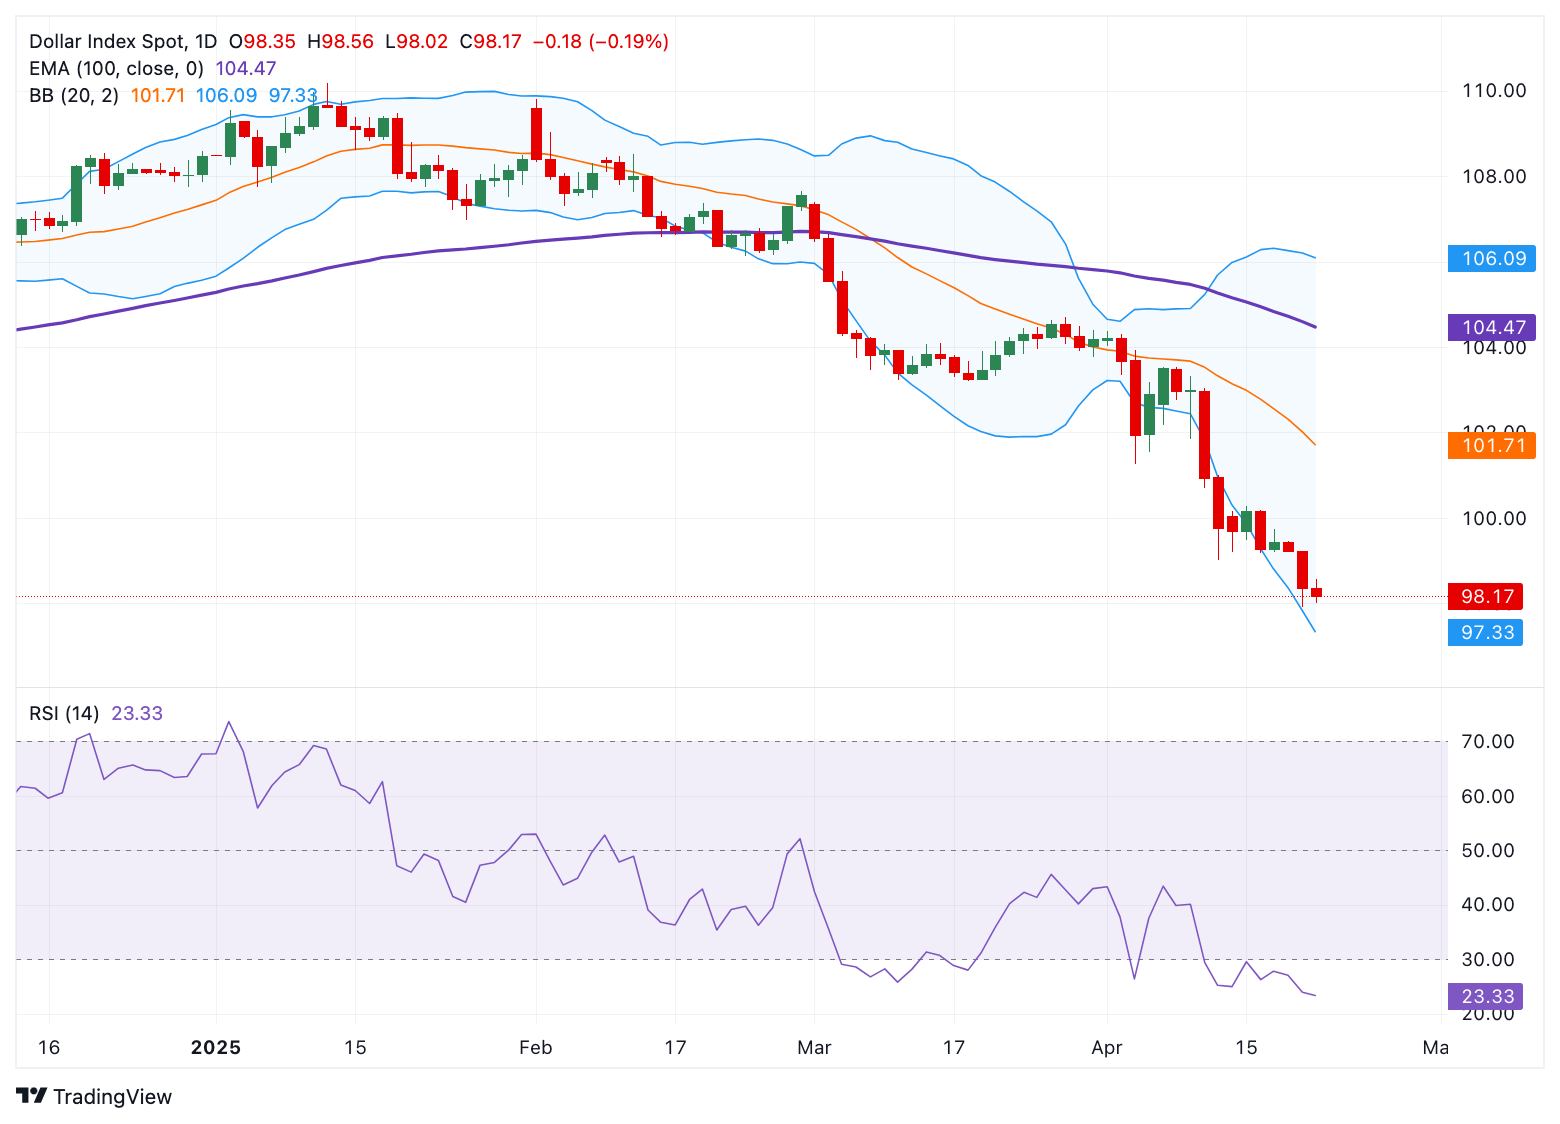
The first support level to watch is 97.30; the key resistance level is seen at the 100.00 round mark.
The US Dollar Index (DXY), an index of the value of the US Dollar (USD) measured against a basket of six world currencies, extends its downside to near 98.15, the lowest since March 2022. The USD weakens across the board as fears over the independence of the Federal Reserve (Fed) intensified.
Trump slammed the Fed’s Powell for continuing to support a “wait and see” mode on the monetary policy until greater clarity over how the new tariff policy will shape the economic outlook. Trump warned that the US economy would slow unless Powell decided to cut the interest rates immediately. Additionally, the uncertainty surrounding Trump’s trade policies and his sweeping tariffs has already shaken global markets, undermining the US Dollar against its rivals in the near term.
Technically, the bearish sentiment of the DXY remains intact as the index holds below the key 100-day Exponential Moving Average (EMA) on the daily chart. The downward momentum is supported by the 14-day Relative Strength Index (RSI), which stands below the midline. Nonetheless, the oversold RSI condition indicates that further consolidation or temporary recovery cannot be ruled out before positioning for any near-term DXY depreciation.
The lower limit of the Bollinger Band at 97.30 acts as an initial support level for the DXY. A breach of this level could drag the index lower to 96.55, the low of February 25, 2022. Extended losses could see a drop to 95.14, the low of February 3, 2022.
On the other hand, the 100.00 psychological level appears to be a tough nut to crack for USD bulls. Any follow-through buying above the mentioned level could pave the way to 101.54, the low of April 4. The key upside barrier for the DXY is seen at 104.45, the 100-day EMA.
US Dollar Index (DXY) daily chart
* The content presented above, whether from a third party or not, is considered as general advice only. This article should not be construed as containing investment advice, investment recommendations, an offer of or solicitation for any transactions in financial instruments.


