


Three Consecutive Gains for US Dollar Index! Can the Trend Continue?


Market Review
Last week, the US Dollar Index rose by 1%, marking its third consecutive week of rebound. The New Zealand Dollar performed the worst, falling by 3.9%, while the South Korean Won showed a better performance, rising by 0.2%.
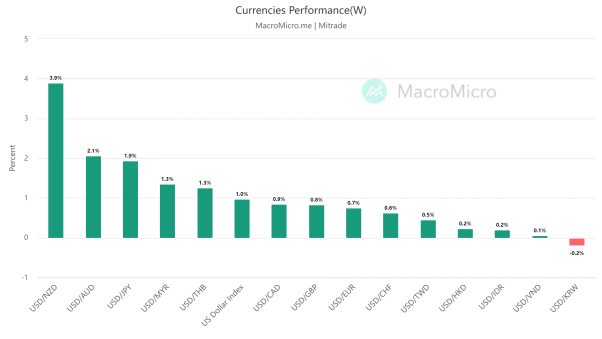
【Source:MacroMicro 22/05/2023-26/05/2023】
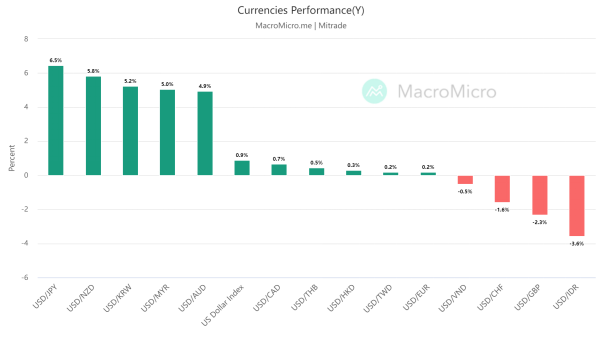
【Source:MacroMicro 1/1/2023-26/05/2023】
1. US Dollar Returns to Strength, Euro Continues to Retreat
Due to better-than-expected US economic data and frequent hawkish statements from Federal Reserve officials, the market expects the Federal Reserve to further raise interest rates. This has led to an increase in US bond yields, widening the spread with European government bonds, and resulting in a stronger US dollar and a weaker euro.
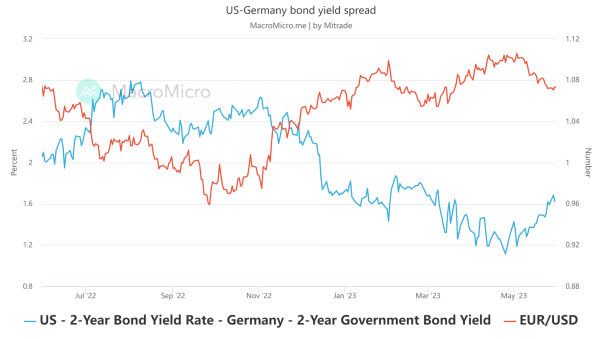
【Source:MacroMicro 】
In addition, the weak performance of economic data in European countries is also one of the reasons for the sluggishness of the euro. On May 25th, data from the German Federal Statistical Office showed that Germany's GDP declined by 0.3% on a quarterly basis in the first quarter of this year, marking two consecutive quarters of negative growth.
The current round of euro correction bears similarities to the one observed in February-March this year, as both were driven by the market's repricing of the Federal Reserve's tightening policies following stronger-than-expected economic data from the United States, leading to widening yield differentials. However, in the long term, rising interest rates can intensify financial risks, and the upward potential for the Fed's tightening pricing is limited, which would constrain the increase in US bond yields.
Mitrade Analyst:
With the debt ceiling being reached and a substantial issuance of US Treasury bonds, there will be a certain reduction in US dollar liquidity. In the short term, the interest rate differential between Europe and America will further widen, which will have a negative impact on the euro.
2. Market Bets on Yen Depreciation, What Will the Future Trend Be?
Last week, the Japanese yen depreciated by approximately 1.9% against the US dollar, once again becoming the weakest currency in Asia. The depreciation was primarily driven by the strength of the US dollar and the dovish stance maintained by the Bank of Japan.
Speculators' bearish positions on the Japanese yen have risen to their highest level in nearly a year as the market bets on the Federal Reserve's potential interest rate hikes, causing the yen to continue its downward trend against the US dollar. According to data from the US Commodity Futures Trading Commission (CFTC) as of May 23rd, leveraged funds' net short contracts on the yen increased to 53,706 contracts, the highest level since June last year.
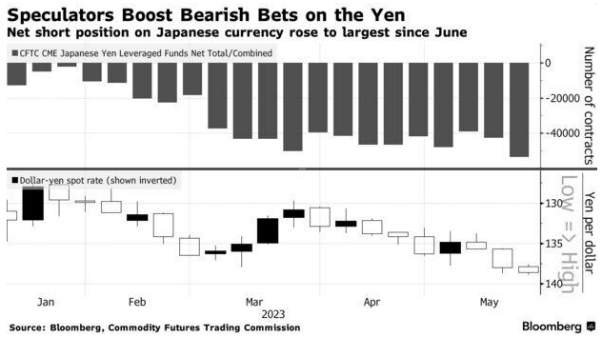
【Source:Bloomberg】
We believe that there is still a possibility of the Bank of Japan adjusting its Yield Curve Control (YCC) policy within this year. One reason is that the Japanese economy has shown better-than-expected growth, and another reason is that core inflation in Japan continues to rise. UBS, an institutional bank, believes that the Bank of Japan will adjust its YCC policy sometime between July and October this year, and they project that the yen will rise to 122 by the end of the year, which represents a 15% upside potential compared to the current levels.
Mitrade Analyst:
We maintain a positive long-term outlook on the Japanese yen,however, in the short term, the USD/JPY exchange rate is more susceptible to the impact of the interest rate differential between the United States and Japan. With the backdrop of rising interest rates in the United States, the yen is expected to continue its downward trend.
Read more
* The content presented above, whether from a third party or not, is considered as general advice only. This article should not be construed as containing investment advice, investment recommendations, an offer of or solicitation for any transactions in financial instruments.


