

USD/CAD Price Forecast: Remains subdued below 1.4200 near falling wedge’s lower threshold

- Gold Price Forecast: US Non-Farm Payrolls Miss Expectations, Gold Surges Over $100, Can the Bull Run Continue?
- Gold Price Forecast: XAU/USD struggles to extend recovery above 20-day EMA
- Gold gains momentum above $4,100 after weak US NFP data
- TradingKey Daily Market Briefing: OPEC+ Continues Output Boost, Oil Prices Under Pressure, Gold Rebounds, Bitcoin Stands Above $63,000
- Japanese Yen declines towards 162.00 vs USD as carry trades counter intervention risks
- WTI slips below $68.00 as supply concerns ease
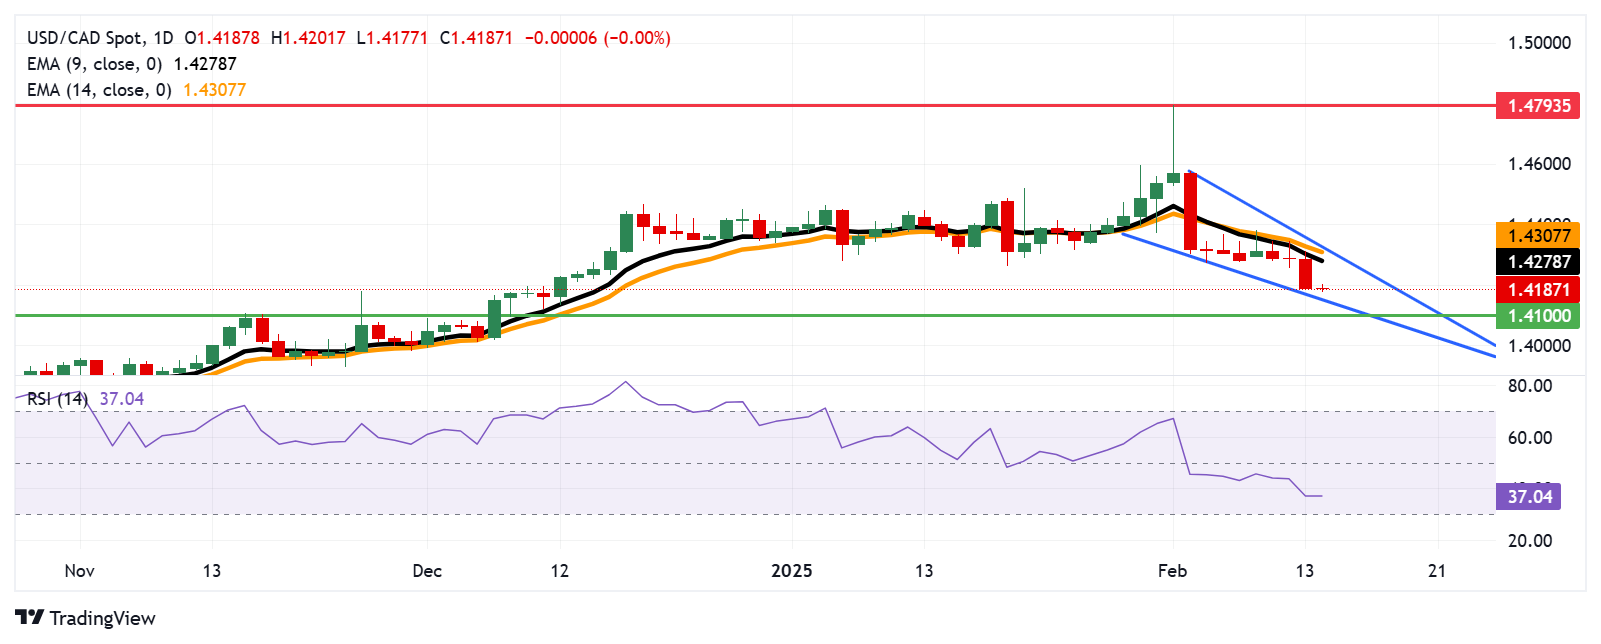
USD/CAD may test immediate support at the lower threshold of the falling wedge at 1.4160.
The daily chart technical analysis shows a falling wedge pattern, signaling a potential upward correction.
The primary resistance appears at the nine-day EMA of 1.4278.
The USD/CAD pair continues its losing streak for the fourth successive session, trading around 1.4190 during the Asian hours on Friday. The daily chart's technical analysis shows a falling wedge pattern, which is a bullish chart pattern that signals a potential breakout to the upside.
Additionally, the 14-day Relative Strength Index (RSI) is approaching the 30 level, reinforcing the prevailing bearish outlook. However, a drop below 30 would indicate an oversold condition for the USD/CAD pair, potentially signaling an upcoming upward correction.
However, the USD/CAD pair continues to trade below the nine- and 14-day Exponential Moving Averages (EMAs), highlighting persistent bearish sentiment and weak short-term price action. This positioning still suggests sustained selling pressure.
On the downside, the USD/CAD pair could find its immediate support at the lower threshold of the falling wedge at 1.4160, followed by the psychological level of 1.4100.
The USD/CAD pair may find immediate resistance around the nine-day EMA at 1.4278, followed by the 14-day EMA at 1.4307. A breakout above these levels may strengthen short-term momentum and support the pair to test the upper boundary of the falling wedge at the 1.4330 level.
USD/CAD: Daily Chart
Read more
* The content presented above, whether from a third party or not, is considered as general advice only. This article should not be construed as containing investment advice, investment recommendations, an offer of or solicitation for any transactions in financial instruments.


