


USD/JPY Price Forecast: Consolidates within the 148.00-149.50 range


USD/JPY edges higher, trading within a range of 148.00-149.50 as US 10-year yields rise to 4.104%.
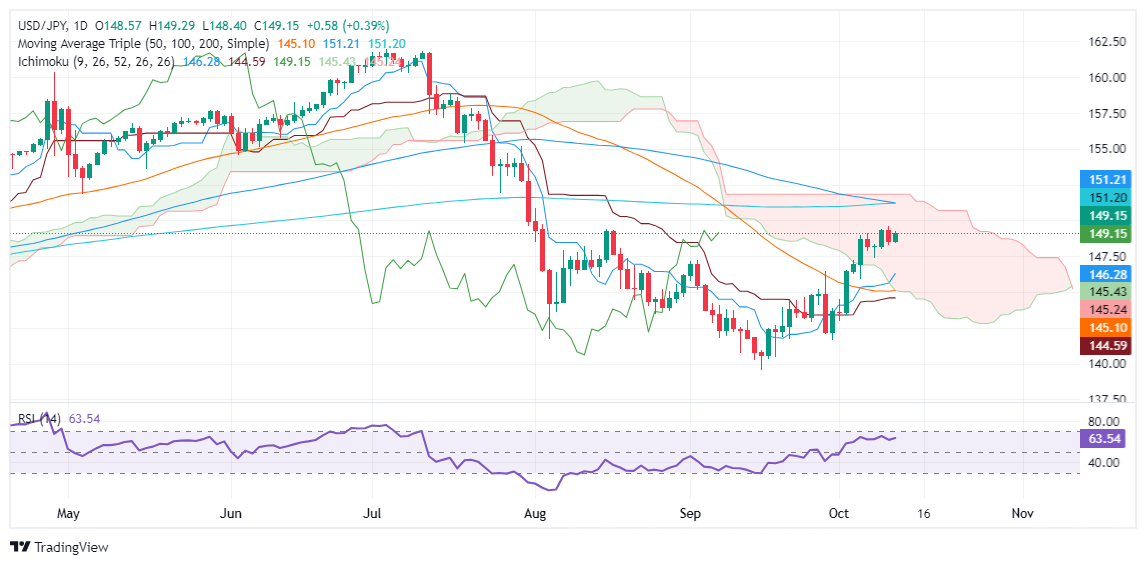
Momentum favors buyers, with a break above 149.50, exposing the key 150.00 level and resistance at the 200/100-DMA confluence at 151.20/21.
A drop below 149.00 could lead to a pullback toward the October 8 swing low of 147.35.
The USD/JPY edged higher during the North American session as US Treasury yields remained higher, particularly the 10-year T-note, which was up close to four basis points at 4.104%. The positive correlation between the US 10-year yield and the pair pushed the exchange rate to 149.13, up 0.37%.
USD/JPY Price Forecast: Technical outlook
The USD/JPY is still neutrally biased, though trading in a higher range within the 148.00-149.50 area, as traders decipher the Fed and the Bank of Japan's next move.
From a momentum standpoint, buyers remain in charge, yet the Relative Strength Index (RSI) hasn’t reached a new peak to push USD/JPY prices higher.
If USD/JPY clears the 149.50 area, this will immediately expose the 150.00 figure. Once removed, the next resistance would be the 200 and 100-day moving averages (DMAs) confluence at 151.20/21.
Conversely, if the pair drops below 149.00, look for a pullback toward the October 8 swing low of 147.35.
USD/JPY Price Action – Daily Chart
Read more
* The content presented above, whether from a third party or not, is considered as general advice only. This article should not be construed as containing investment advice, investment recommendations, an offer of or solicitation for any transactions in financial instruments.


