

XRP Price Reclaims $0.50 and Indicators Suggest Fresh Surge To $0.70

- WTI Oil pulls back as Hormuz supply worries ease, Iran-US tensions keep volatility high
- Trump says US to help ships stranded in Strait of Hormuz as tanker hit by projectiles
- WTI falls to near $93.50 after Israel, Iran signal an end to hostilities
- Bitcoin Price Forecast: BTC hits three-month high on derivatives-led surge
- Australian Dollar holds losses ahead of RBA policy decision
- Ignoring Strategy Reduction Warning, Bitcoin Nears $82,000, Hitting Highest Price Since February

XRP price is recovering higher above the $0.500 resistance. The price is signaling a positive bias and might rally above the $0.580 and $0.600 levels.
■ XRP is attempting a recovery wave above the $0.50 zone.
■ The price is now trading above $0.5150 and the 100 simple moving average (4 hours).
■ There was a break above a key bearish trend line with resistance at $0.5220 on the 4-hour chart of the XRP/USD pair (data source from Kraken).
■ The pair could gain bullish momentum if there is a close above the $0.580 resistance.
XRP Price Aims Higher
After a sharp decline, XRP price found support near the $0.3880 zone. It formed a base and started a fresh increase above the $0.450 resistance, like Bitcoin and Ethereum. The bulls were able to push the price above the $0.50 resistance.
The price climbed above the 50% Fib retracement level of the downward move from the $0.6420 swing high to the $0.3875 low. Besides, there was a break above a key bearish trend line with resistance at $0.5220 on the 4-hour chart of the XRP/USD pair.
The price is now trading above $0.5150 and the 100 simple moving average (4 hours). Immediate resistance is near the $0.5650 level. The next key resistance is near $0.5820 or the 76.4% Fib retracement level of the downward move from the $0.6420 swing high to the $0.3875 low.
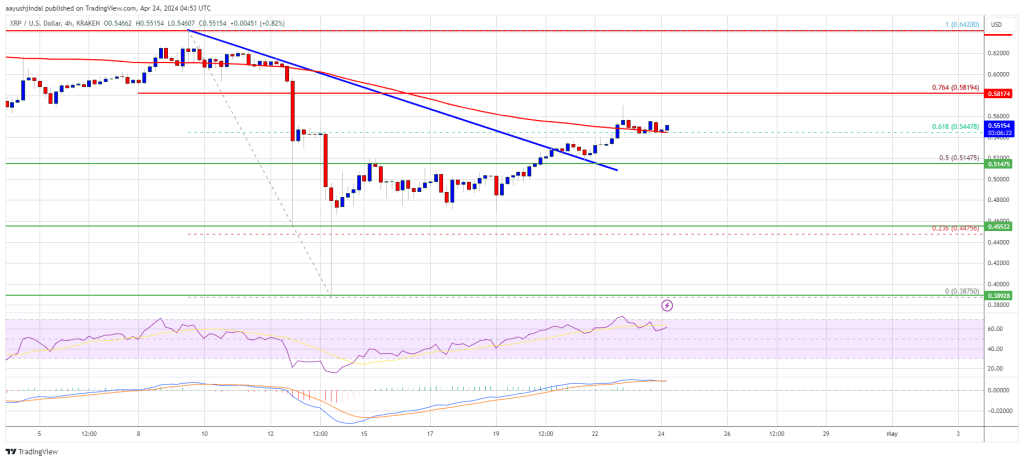
Source: XRPUSD on TradingView.com
A close above the $0.5820 resistance zone could spark a strong increase. The next key resistance is near $0.620. If the bulls remain in action above the $0.620 resistance level, there could be a rally toward the $0.680 resistance. Any more gains might send the price toward the $0.700 resistance.
Another Drop?
If XRP fails to clear the $0.5820 resistance zone, it could start another decline. Initial support on the downside is near the $0.540 level.
The next major support is at $0.5150. If there is a downside break and a close below the $0.5150 level, the price might accelerate lower. In the stated case, the price could retest the $0.4650 support zone.
Technical Indicators
4-Hours MACD – The MACD for XRP/USD is now gaining pace in the bullish zone.
4-Hours RSI (Relative Strength Index) – The RSI for XRP/USD is now above the 50 level.
Major Support Levels – $0.540, $0.5150, and $0.4650.
Major Resistance Levels – $0.5650, $0.5820, and $0.6200.
Read more
* The content presented above, whether from a third party or not, is considered as general advice only. This article should not be construed as containing investment advice, investment recommendations, an offer of or solicitation for any transactions in financial instruments.


