


Ripple Price Prediction: XRP signals breakout as spot ETF prospects brighten

- Bitcoin Drops to $70,000. U.S. Government Refuses to Bail Out Market, End of Bull Market or Golden Pit?
- Gold rallies further beyond $5,050 amid flight to safety, dovish Fed expectations
- Bitcoin Bottom Debate: $70,000 or $50,000?
- A Crash After a Surge: Why Silver Lost 40% in a Week?
- Bitcoin Slips Below 75,000 Mark. Will Strategy Change Its Mind and Sell?
- Bitcoin Rout. Bridgewater Founder Dalio Publicly Backs Gold.

XRP holders’ confidence grows as the chances of XRP spot ETF approvals jump to 85% from 65% in less than two months.
XRP remains above support at $2.20, highlighted by a confluence of the 50- and 100-day EMAs.
Traders anticipate a breakout above descending trendline resistance, backed by a buy signal from the MACD indicator.
Still, discussion around XRP relative to other top cryptocurrencies has declined, increasing downside risks.
Ripple (XRP) price remains firmly supported at $2.20, while trading at $2.22 at the time of writing on Friday. The XRP community is growing increasingly confident in its holdings amid renewed optimism for the approval of spot XRP Exchange Traded Funds (ETFs) following the change in leadership at the Securities and Exchange Commission (SEC). If XRP confirms a break above a four-month descending trendline in the daily time frame, gains could accelerate towards $3.00.
XRP spot ETF approval chances jump
The change of leadership at the SEC, with Paul Atkins as the Chair of the regulatory agency, has seen the chances of an XRP spot ETF approval jump to 85% from 65% in just two months. According to Santiment, “traders are now predicting new all-time highs for XRP, and betting platforms like Polymarket reflect this shift, with 79% odds of approval by the end of the year.”
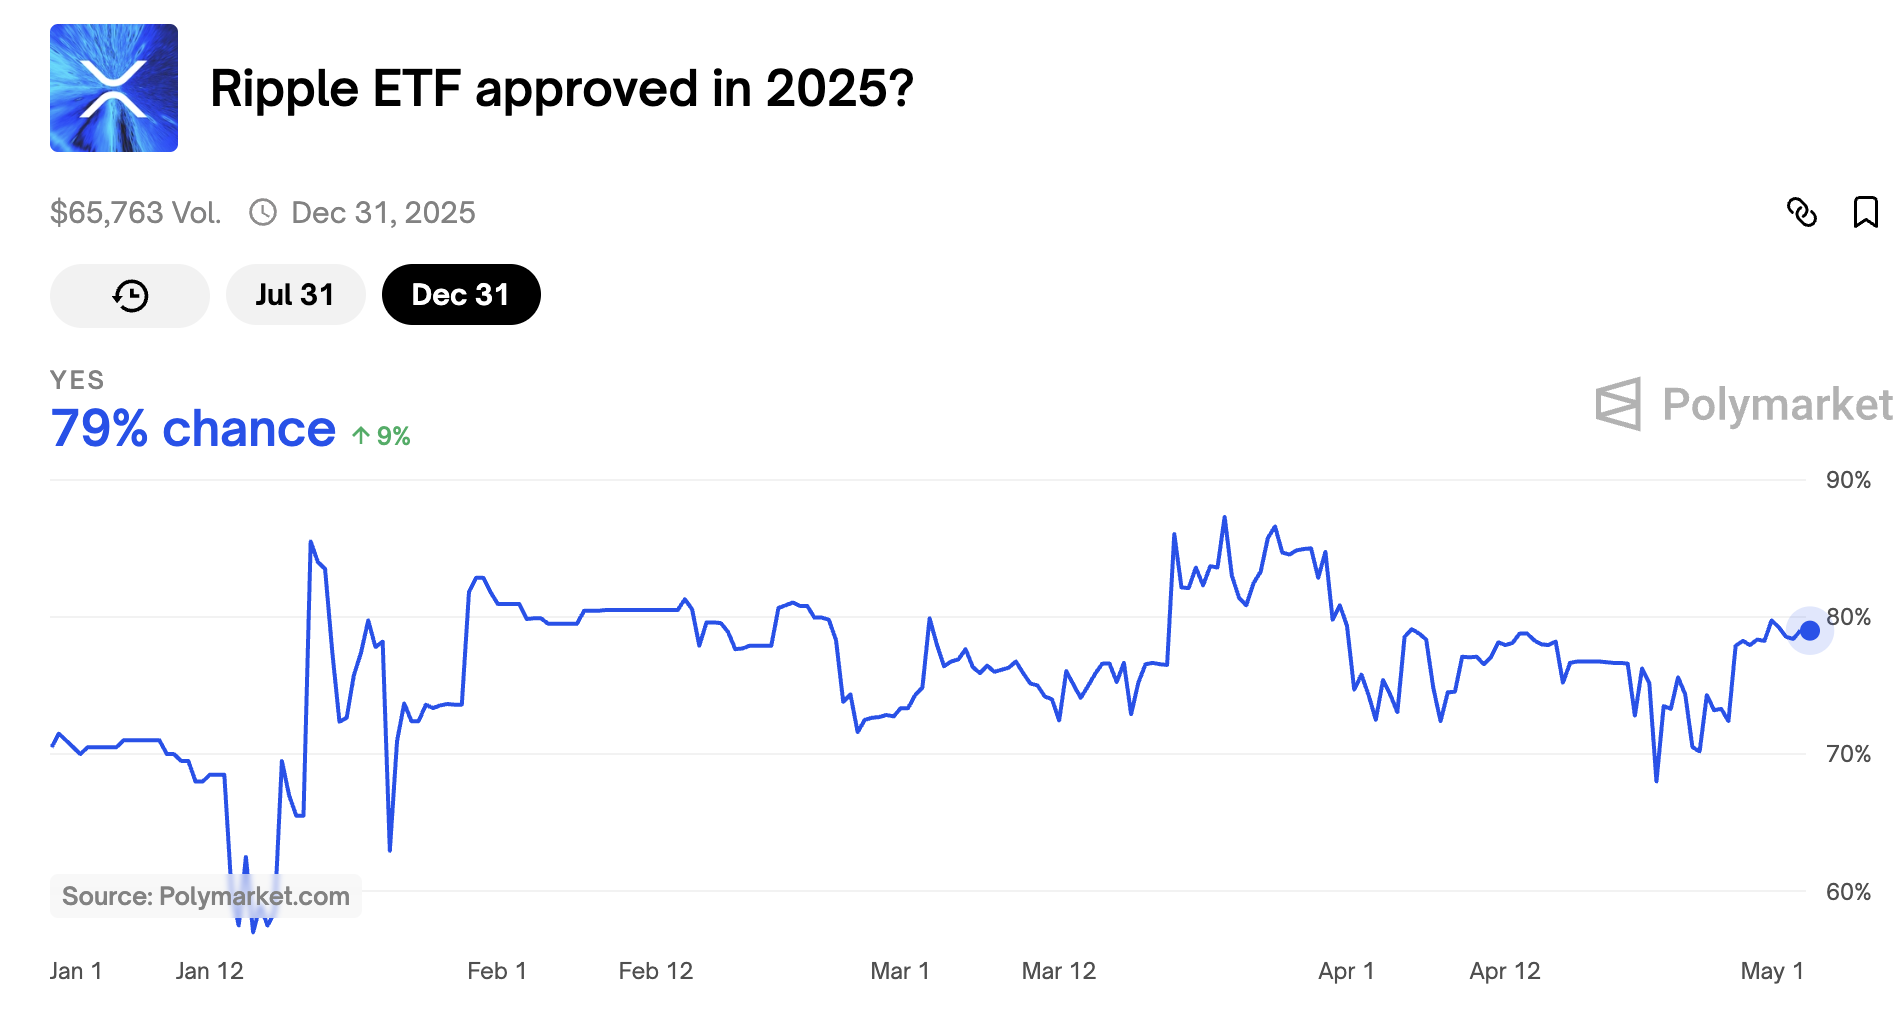
Spot XRP ETF approval odds | Source: Polymarket
The prospects of a spot XRP ETF approval have remained steady despite the SEC postponing its decision on Franklin Templeton’s spot ETF proposal until June 17. The approval of the spot ETF could significantly alter investment dynamics surrounding XRP, potentially attracting substantial institutional interest and propelling the token into the mainstream financial sector.
XRP uptrend could gain momentum
XRP’s price holds firmly to confluence support at $2.20, established by the 50- and 100-day Exponential Moving Averages (EMA). Despite the pivotal movement around this level in the past week, XRP shows signs of the uptrend’s continuation towards a medium-term target of $3.00.
A buy signal in the Moving Average Convergence Divergence (MACD) indicator reinforces the bullish momentum. This signal was confirmed on April 12 when the MACD line (blue) crossed above the signal line (red).
Additionally, the indicator’s movement above the center line, accompanied by the expansion of green histograms, increases the likelihood of a breakout above the descending trendline, as illustrated on the daily chart.
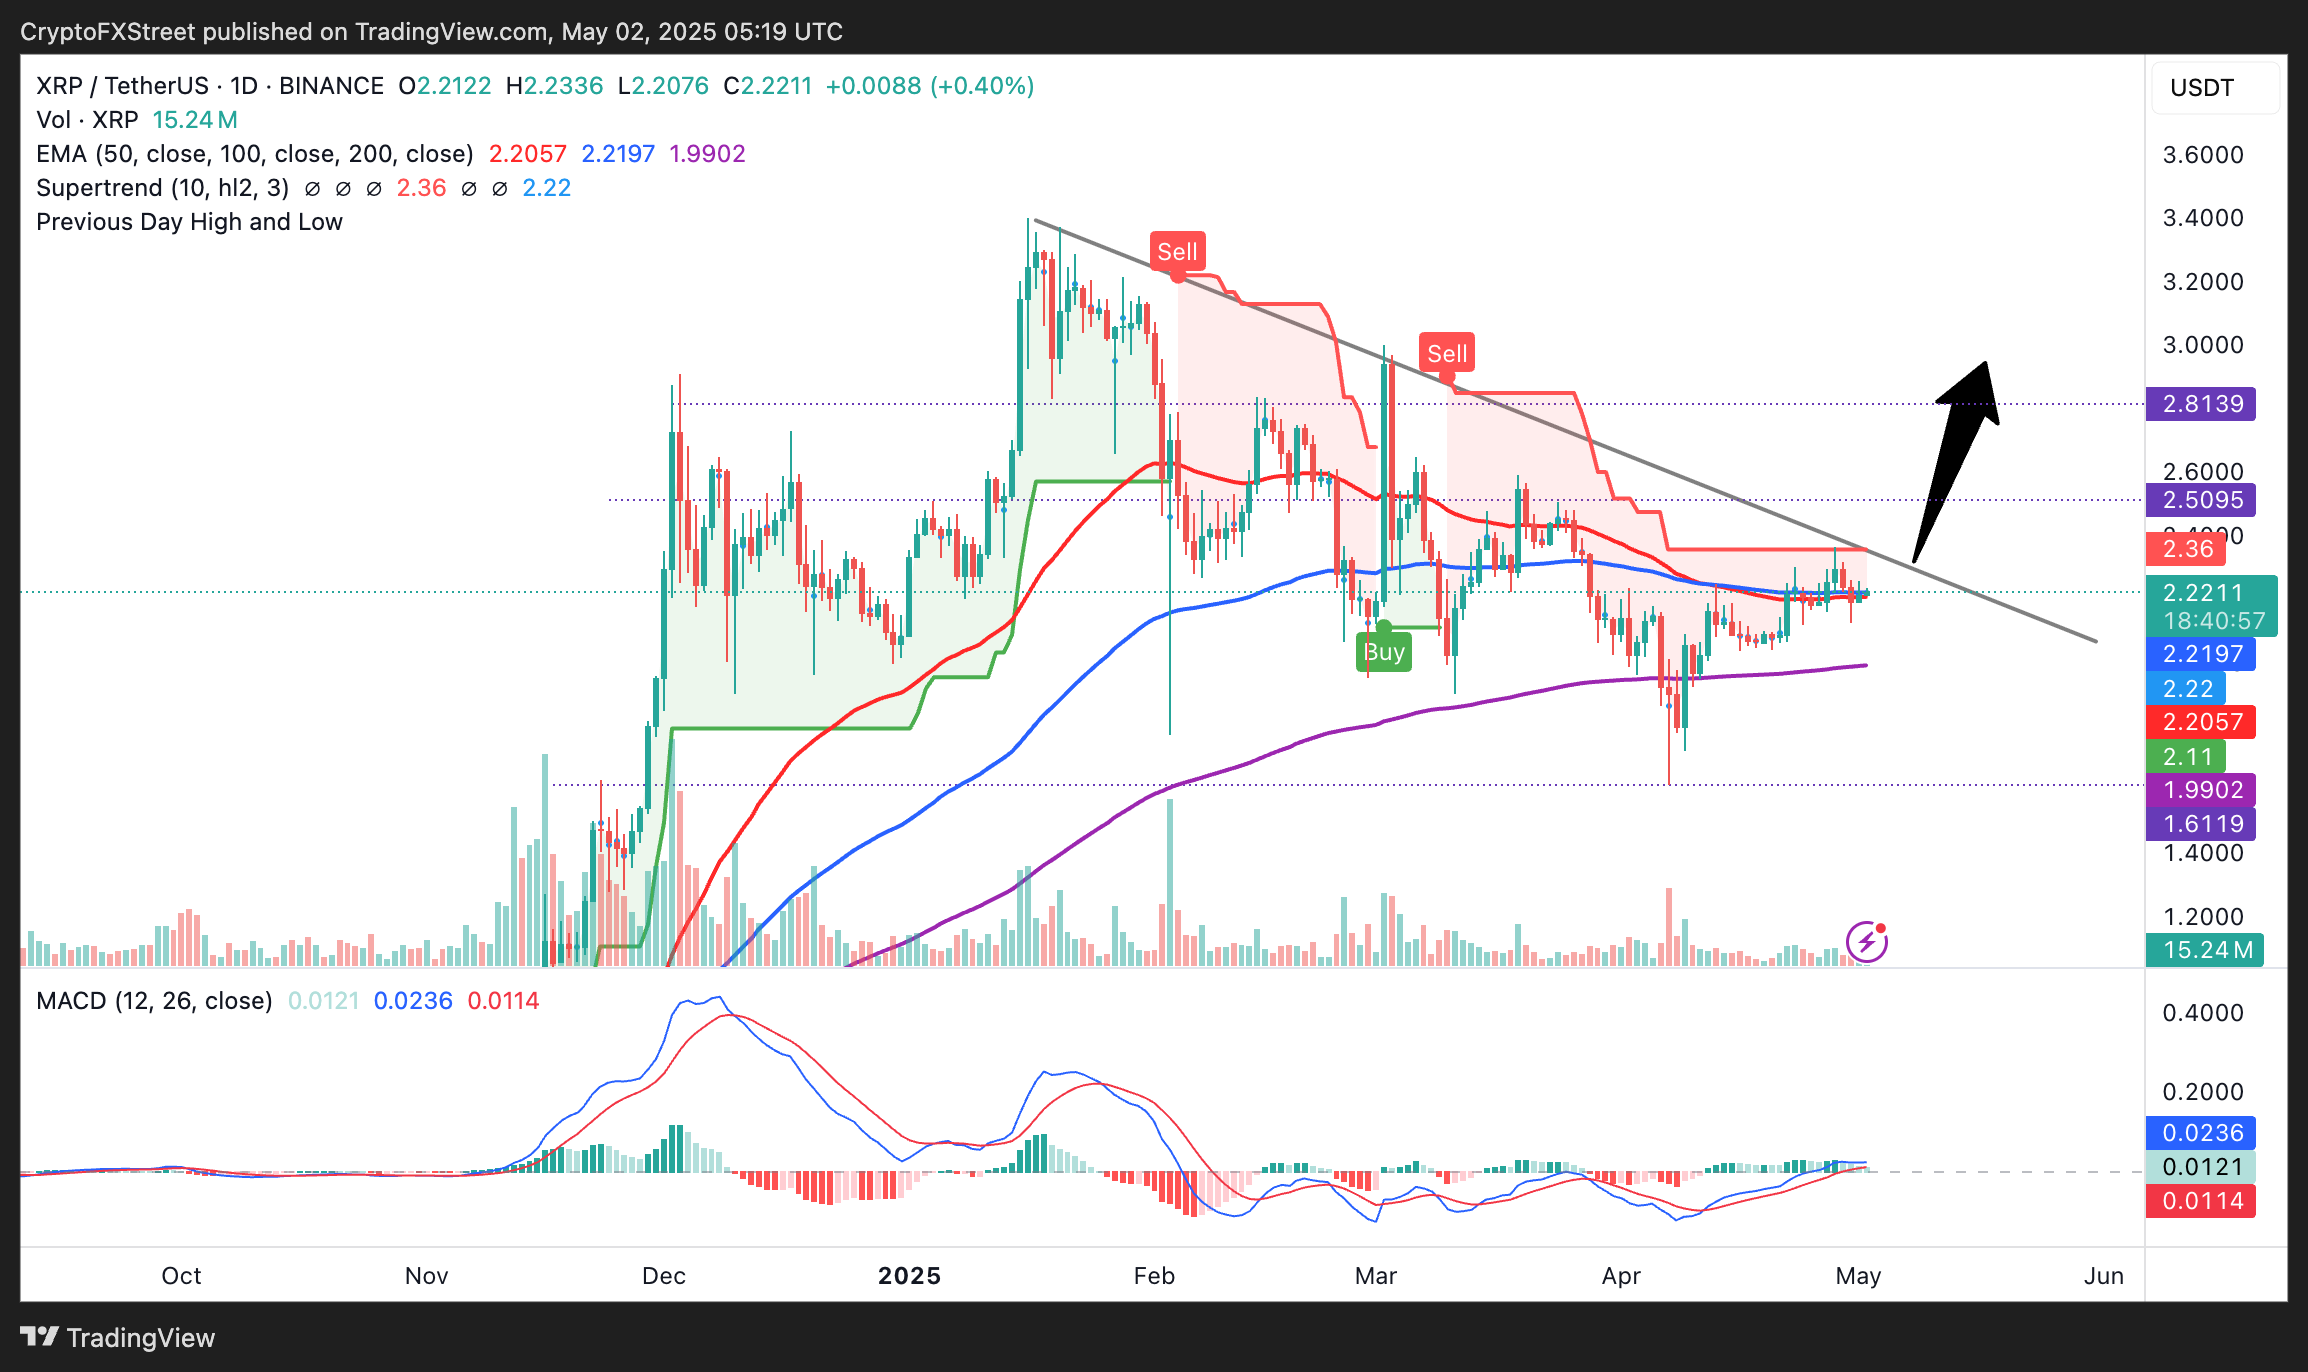
XRP/USDT daily chart
Traders should prepare for possible drawdowns at $2.50 and $2.80 supply zones. Selling due to profit-taking could overwhelm bullish momentum at these levels, slowing the uptrend or even leading to reversals.
The SuperTrend indicator’s sell signal highlights the potential selling pressure in XRP’s recovery path. This indicator sends a sell signal when it flips above the token’s price, changing color from green to red. Traders should consider the position of the SuperTrend when making decisions.
Meanwhile, Santiment’s biweekly market update notes that chatter about XRP, compared to other top cryptocurrencies, has steadily declined over the past three months. This downtrend in social dominance could hold back XRP’s uptrend.
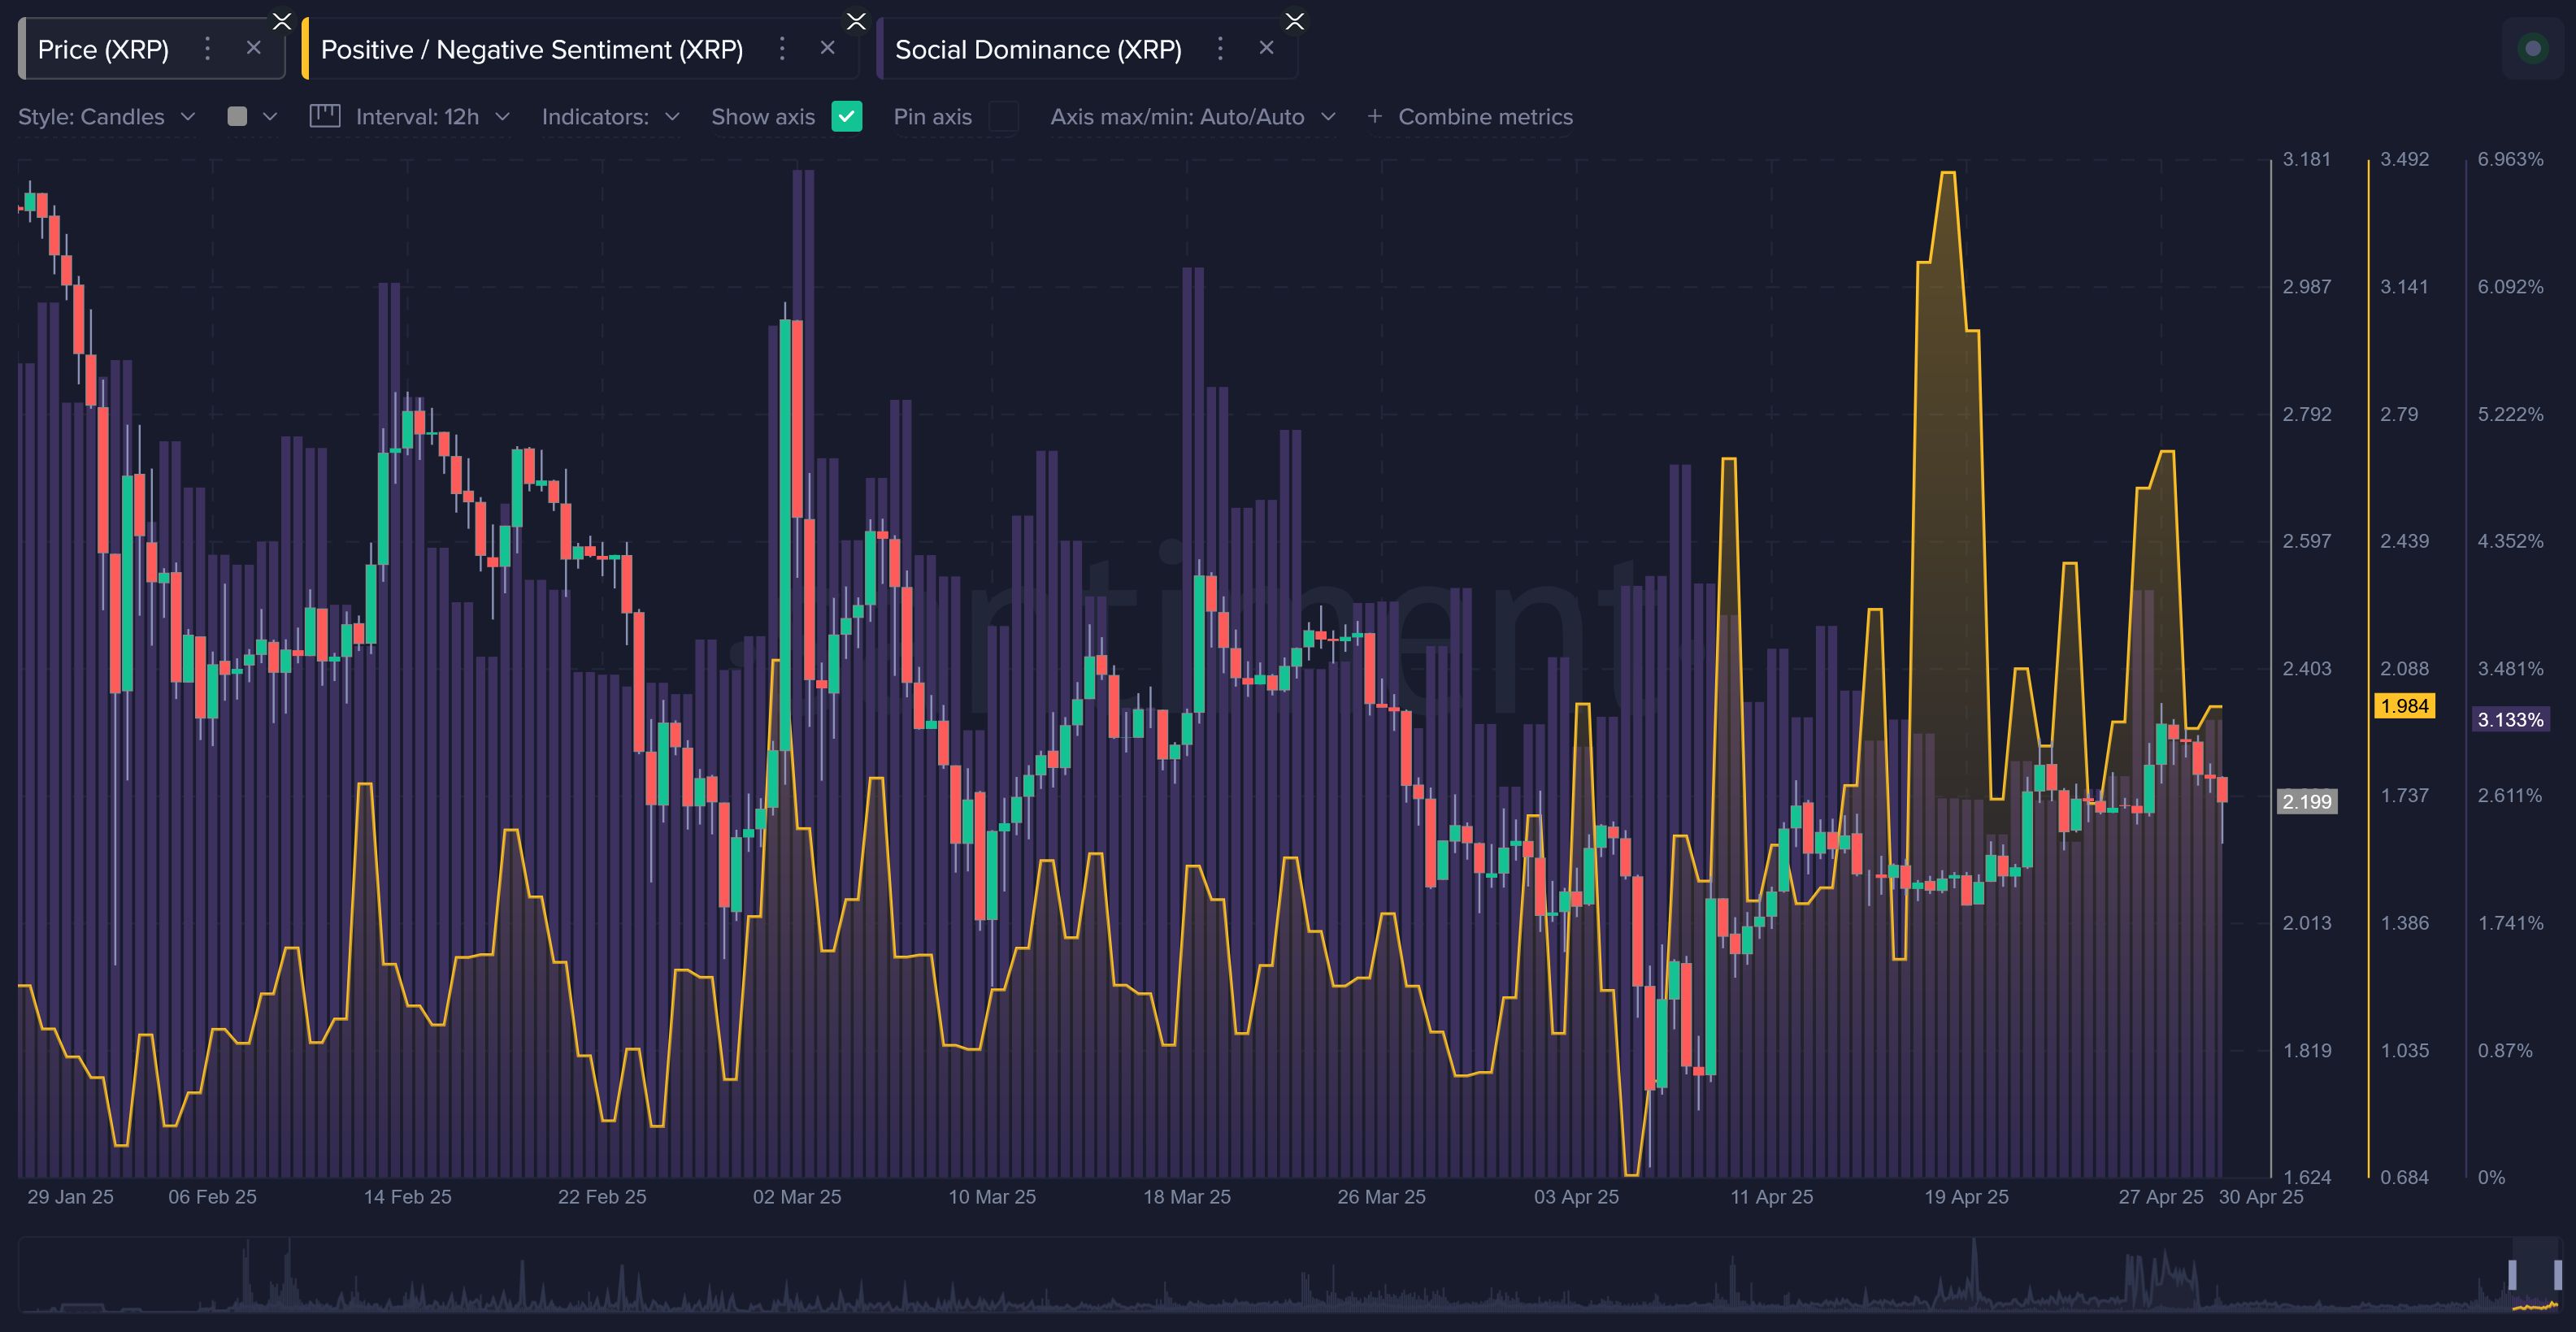
XRP’s ratio of bullish vs. bearish commentary | Source: Santiment
In the event that support at $2.20 gives way, and the XRP price slides, traders would look to the 200-day EMA at $1.99 for a potential rebound. Beyond this level, volatility could spike, creating instability and accelerating losses toward XRP’s April 7 low at $1.61.
Read more
* The content presented above, whether from a third party or not, is considered as general advice only. This article should not be construed as containing investment advice, investment recommendations, an offer of or solicitation for any transactions in financial instruments.


