

Top 3 Price Prediction Bitcoin, Ethereum, Ripple: BTC, ETH and XRP continue to sell off

- Gold Price Trend Forecast: Expectations of Easing US-Iran Tensions Boost Gold Prices, $4,070 Becomes Key Level for Bulls and Bears
- Gold Price Trend Forecast: Why Did Gold Prices Fall After US CPI Cooled? Fed Chair Speech and Iran Situation Become Obstacles
- TradingKey Daily Market Brief: Gold Falls Below $4,000, TSMC’s Strong Earnings Fail to Stop AI Trade Cooling, Chip Stocks Sold Off
- Gold Price Forecast: Cooling Inflation Fails to Offset Fed Hawkish Pressure, Gold Price May Fall to $3,500
- Euro declines to near 1.1400 as US launches fresh strikes on Iran
- Tesla Q2 Earnings Preview: Record Deliveries Fail to Hide Profit Pressure, Can Musk Rely on AI and Autonomous Driving to Unlock New Growth Space?

Bitcoin price continues declining on Friday after falling more than 15% this week.
Ethereum price closed below its daily support level of $2,359, continuing its downward trend.
XRP is approaching its daily support at $1.96; a firm close below would continue its downward momentum.
Bitcoin (BTC) price continues declining on Friday after falling more than 15% this week. Ethereum (ETH) and Ripple (XRP) followed BTC’s footsteps and declined by nearly 24% and 21%, respectively.
Bitcoin bears aiming for the $73,000 mark
Bitcoin price broke out of its prolonged consolidation phase, slipping below the $94,000 support level and closing at $91,552 after a 4.89% decline on Monday. BTC continued its correction by 8.2% in the next three days and closed below its $85,000 support level on Wednesday. At the time of writing on Friday, it continues its sell-off, trading at around $81,000.
If BTC continues its correction, it could extend the decline to test its next support level at $73,000.
The daily chart’s Relative Strength Index (RSI) indicator reads 21, below its oversold conditions and points downwards, indicating significant selling pressure but technically may be due for a potential reversal or bounce. However, traders should be cautious as the RSI may remain below oversold levels and continue correcting.
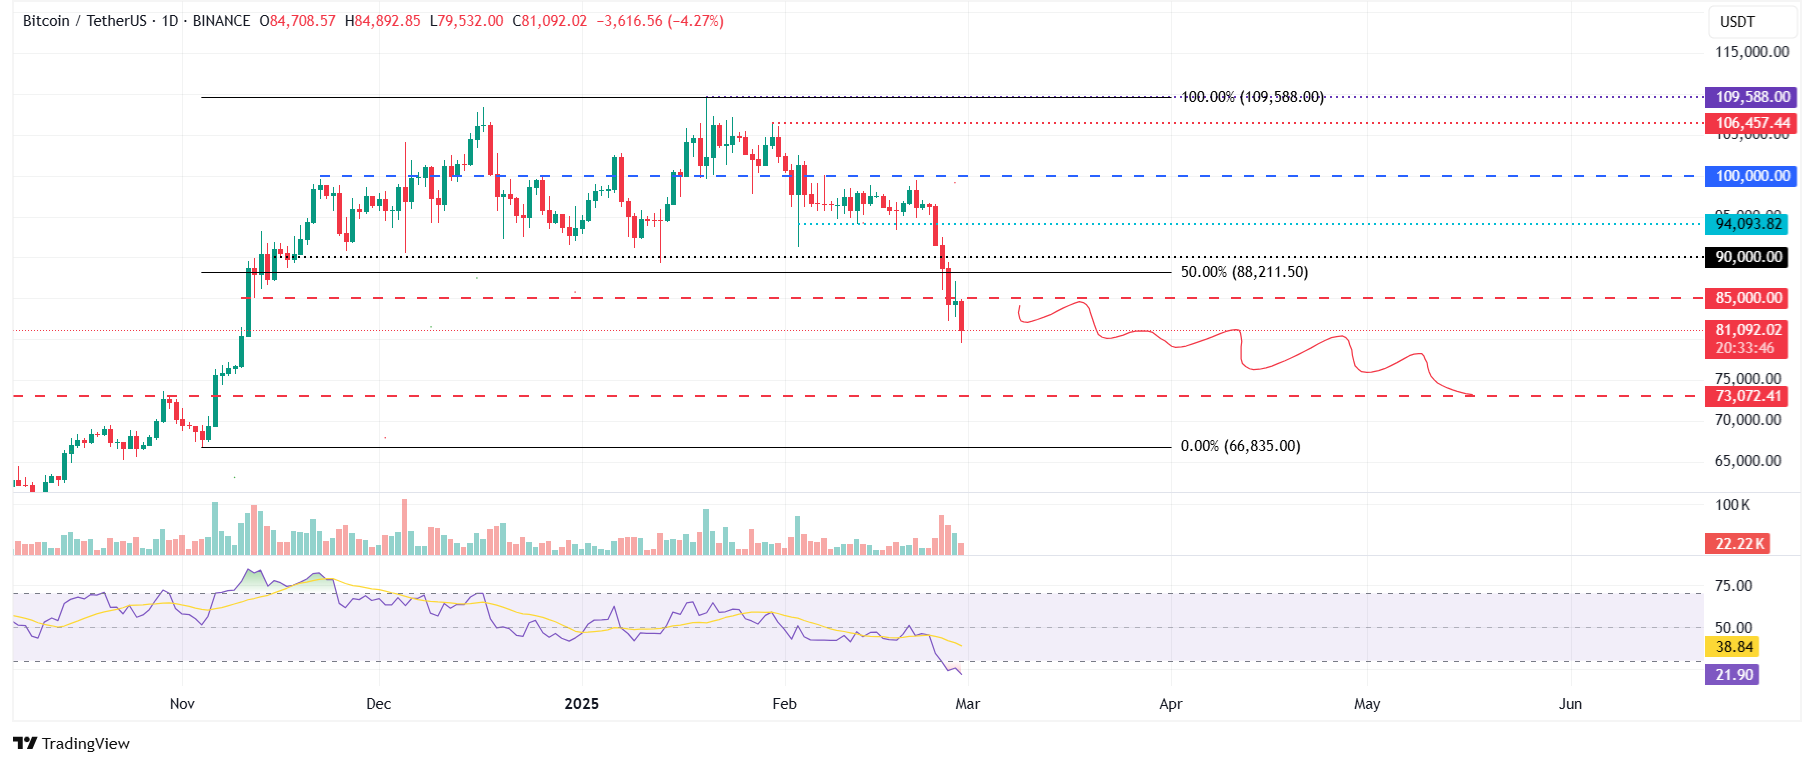
BTC/USDT daily chart
However, if BTC recovers, it could extend the recovery to retest the $85,000 resistance level.
Ethereum is poised for further downside if it closes below $2,125
Ethereum price declined almost 11% on Monday. It continued its downtrend for the next three days, declined 8.4% and closed below its daily support level at $2,359. At the time of writing on Friday, it continues its downleg, retesting its February 3 low of $2,125.
If ETH continues its downtrend and closes below $2,125, it could extend the decline to retest its weekly support level of $1,905.
Like Bitcoin, Ethereum’s RSI on the daily chart reads 27, below its oversold conditions and points downwards, indicating significant selling pressure but technically may be due for a potential reversal or bounce. However, traders should be cautious as the RSI may remain below oversold levels and continue correcting.
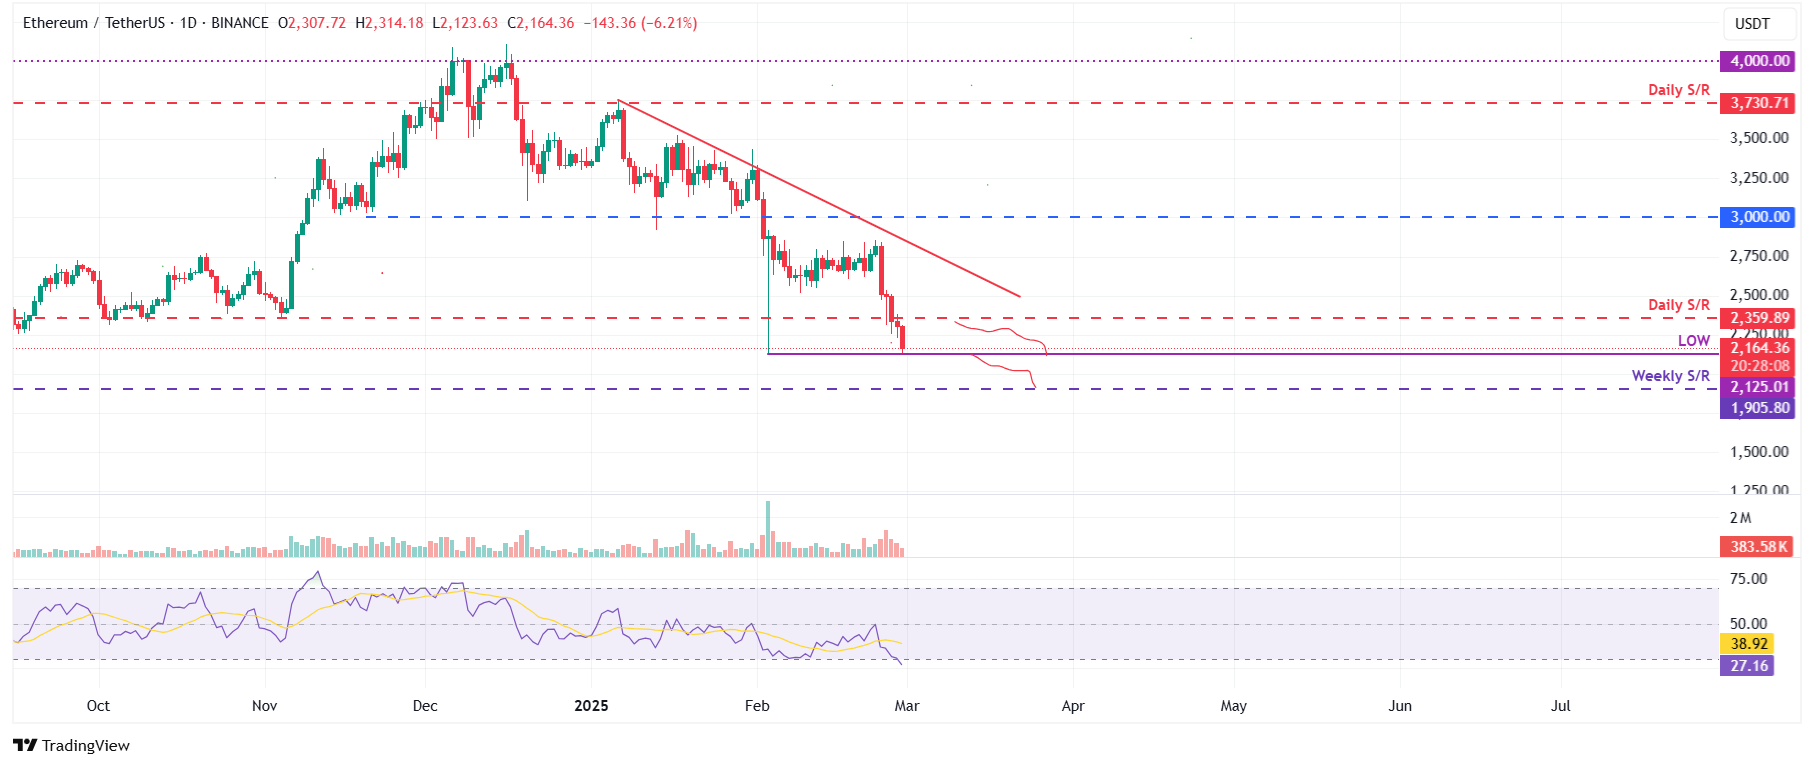
ETH/USDT daily chart
On the other hand, if ETH recovers, it could extend the recovery to test its resistance level at $2,359.
Ripple bears could target the $1.77 level
Ripple price declined nearly 12% on Monday and reached a daily low of $2.06 the next day. XRP continued its decline by 5.33% until Thursday. At the time of writing on Friday, it trades down by 7.6%, at around $2.03.
If XRP closes below the $1.96 daily support level, it will extend the decline to test its February 3 low of $1.77.
The RSI on the daily chart reads 29, below its oversold conditions and points downwards, indicating significant selling pressure but technically may be due for a potential reversal or bounce. However, traders should be cautious as the RSI may remain below oversold levels and continue to correct.
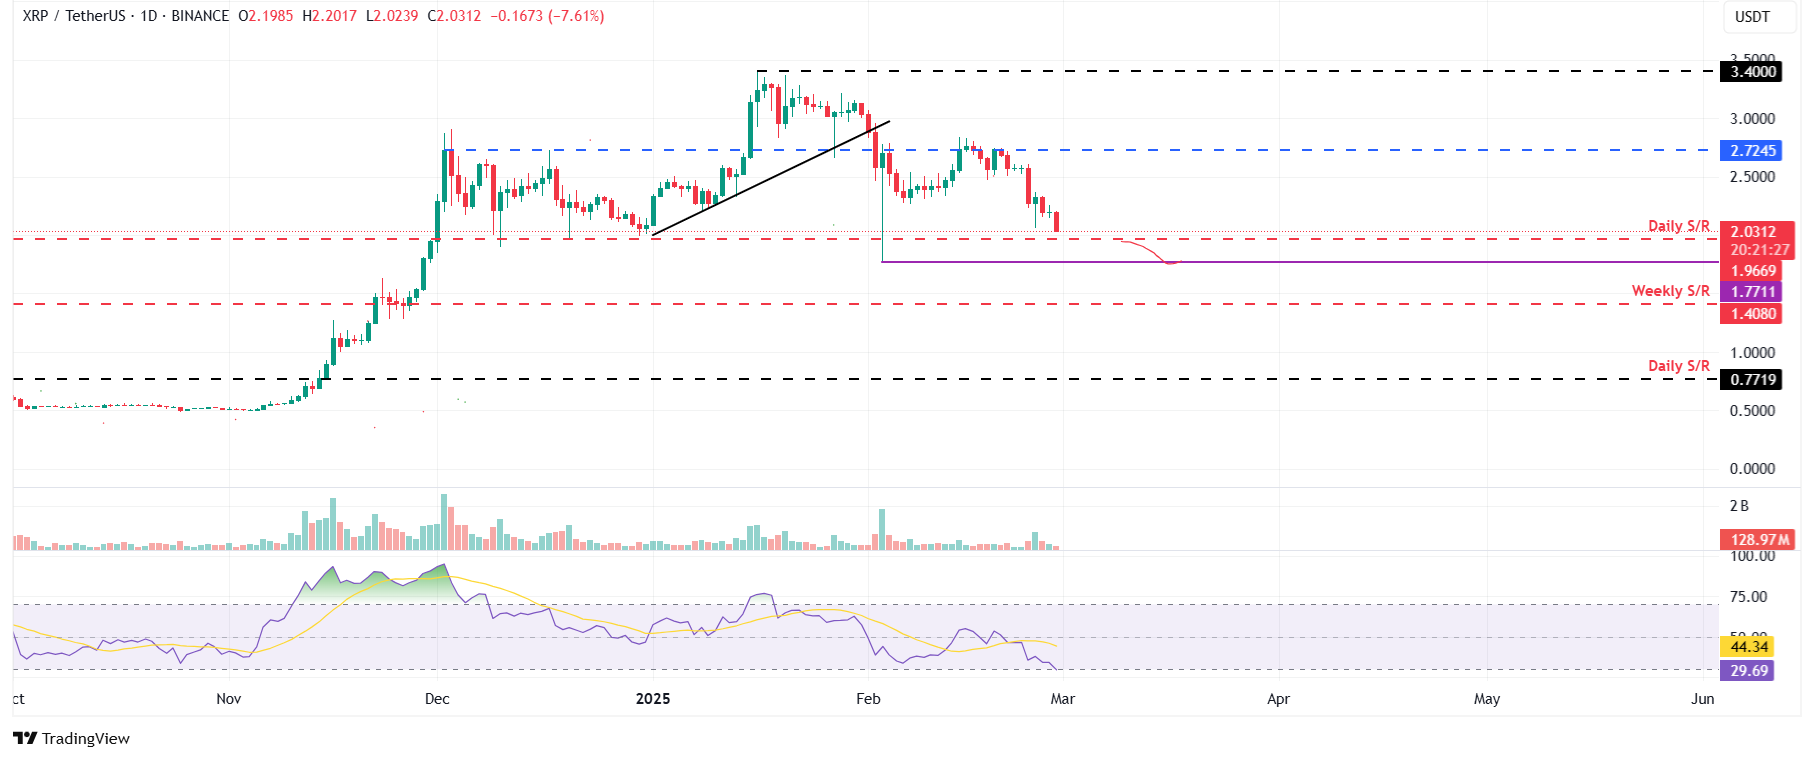
XRP/USDT daily chart
Conversely, if XRP recovers, it could extend the recovery to test its resistance level at $2.72.
Read more
* The content presented above, whether from a third party or not, is considered as general advice only. This article should not be construed as containing investment advice, investment recommendations, an offer of or solicitation for any transactions in financial instruments.


