


XRP Faces Bearish Shift as Indicators Signal Weakness

- Bitcoin Drops to $70,000. U.S. Government Refuses to Bail Out Market, End of Bull Market or Golden Pit?
- Gold rallies further beyond $5,050 amid flight to safety, dovish Fed expectations
- Bitcoin Bottom Debate: $70,000 or $50,000?
- A Crash After a Surge: Why Silver Lost 40% in a Week?
- Bitcoin Slips Below 75,000 Mark. Will Strategy Change Its Mind and Sell?
- Bitcoin Rout. Bridgewater Founder Dalio Publicly Backs Gold.

XRP gained only 2% in the past week, signaling weak momentum and fading interest from buyers in the short term.Technical indicators like the RSI, Ichimoku Cloud, and EMA lines are all starting to reflect increased bearish pressure. Here’s a breakdown of what the charts are saying and what could come next for XRP.
XRP RSI Shows Buyers Are Losing Control
XRP’s Relative Strength Index (RSI) has declined to 46.34, a noticeable drop from 57.30 just one day ago. This sharp move suggests a clear shift in momentum, with buying pressure cooling off significantly in the short term.
When the RSI drops this quickly, it can often indicate that traders are taking profits or beginning to rotate out of a position, especially after a period of modest gains.
While XRP hasn’t entered oversold territory yet, the drop below the 50 mark is typically viewed as a bearish signal, pointing to a potential shift in sentiment from bullish to neutral or bearish.
 XRP RSI. Source: TradingView.
The RSI, or Relative Strength Index, is a widely used technical indicator that helps traders gauge the strength of a price trend. It ranges from 0 to 100, with readings above 70 considered overbought and readings below 30 considered oversold.
When the RSI is above 50, momentum is typically bullish, while levels below 50 reflect increasing bearishness. With XRP now sitting at 46.34, it suggests the asset is losing upward momentum and may be at risk of further downside unless buying interest returns soon.
If selling pressure continues and RSI trends lower, XRP could test key support levels in the near future.
XRP Ichimoku Cloud Shows Momentum Is Shifting
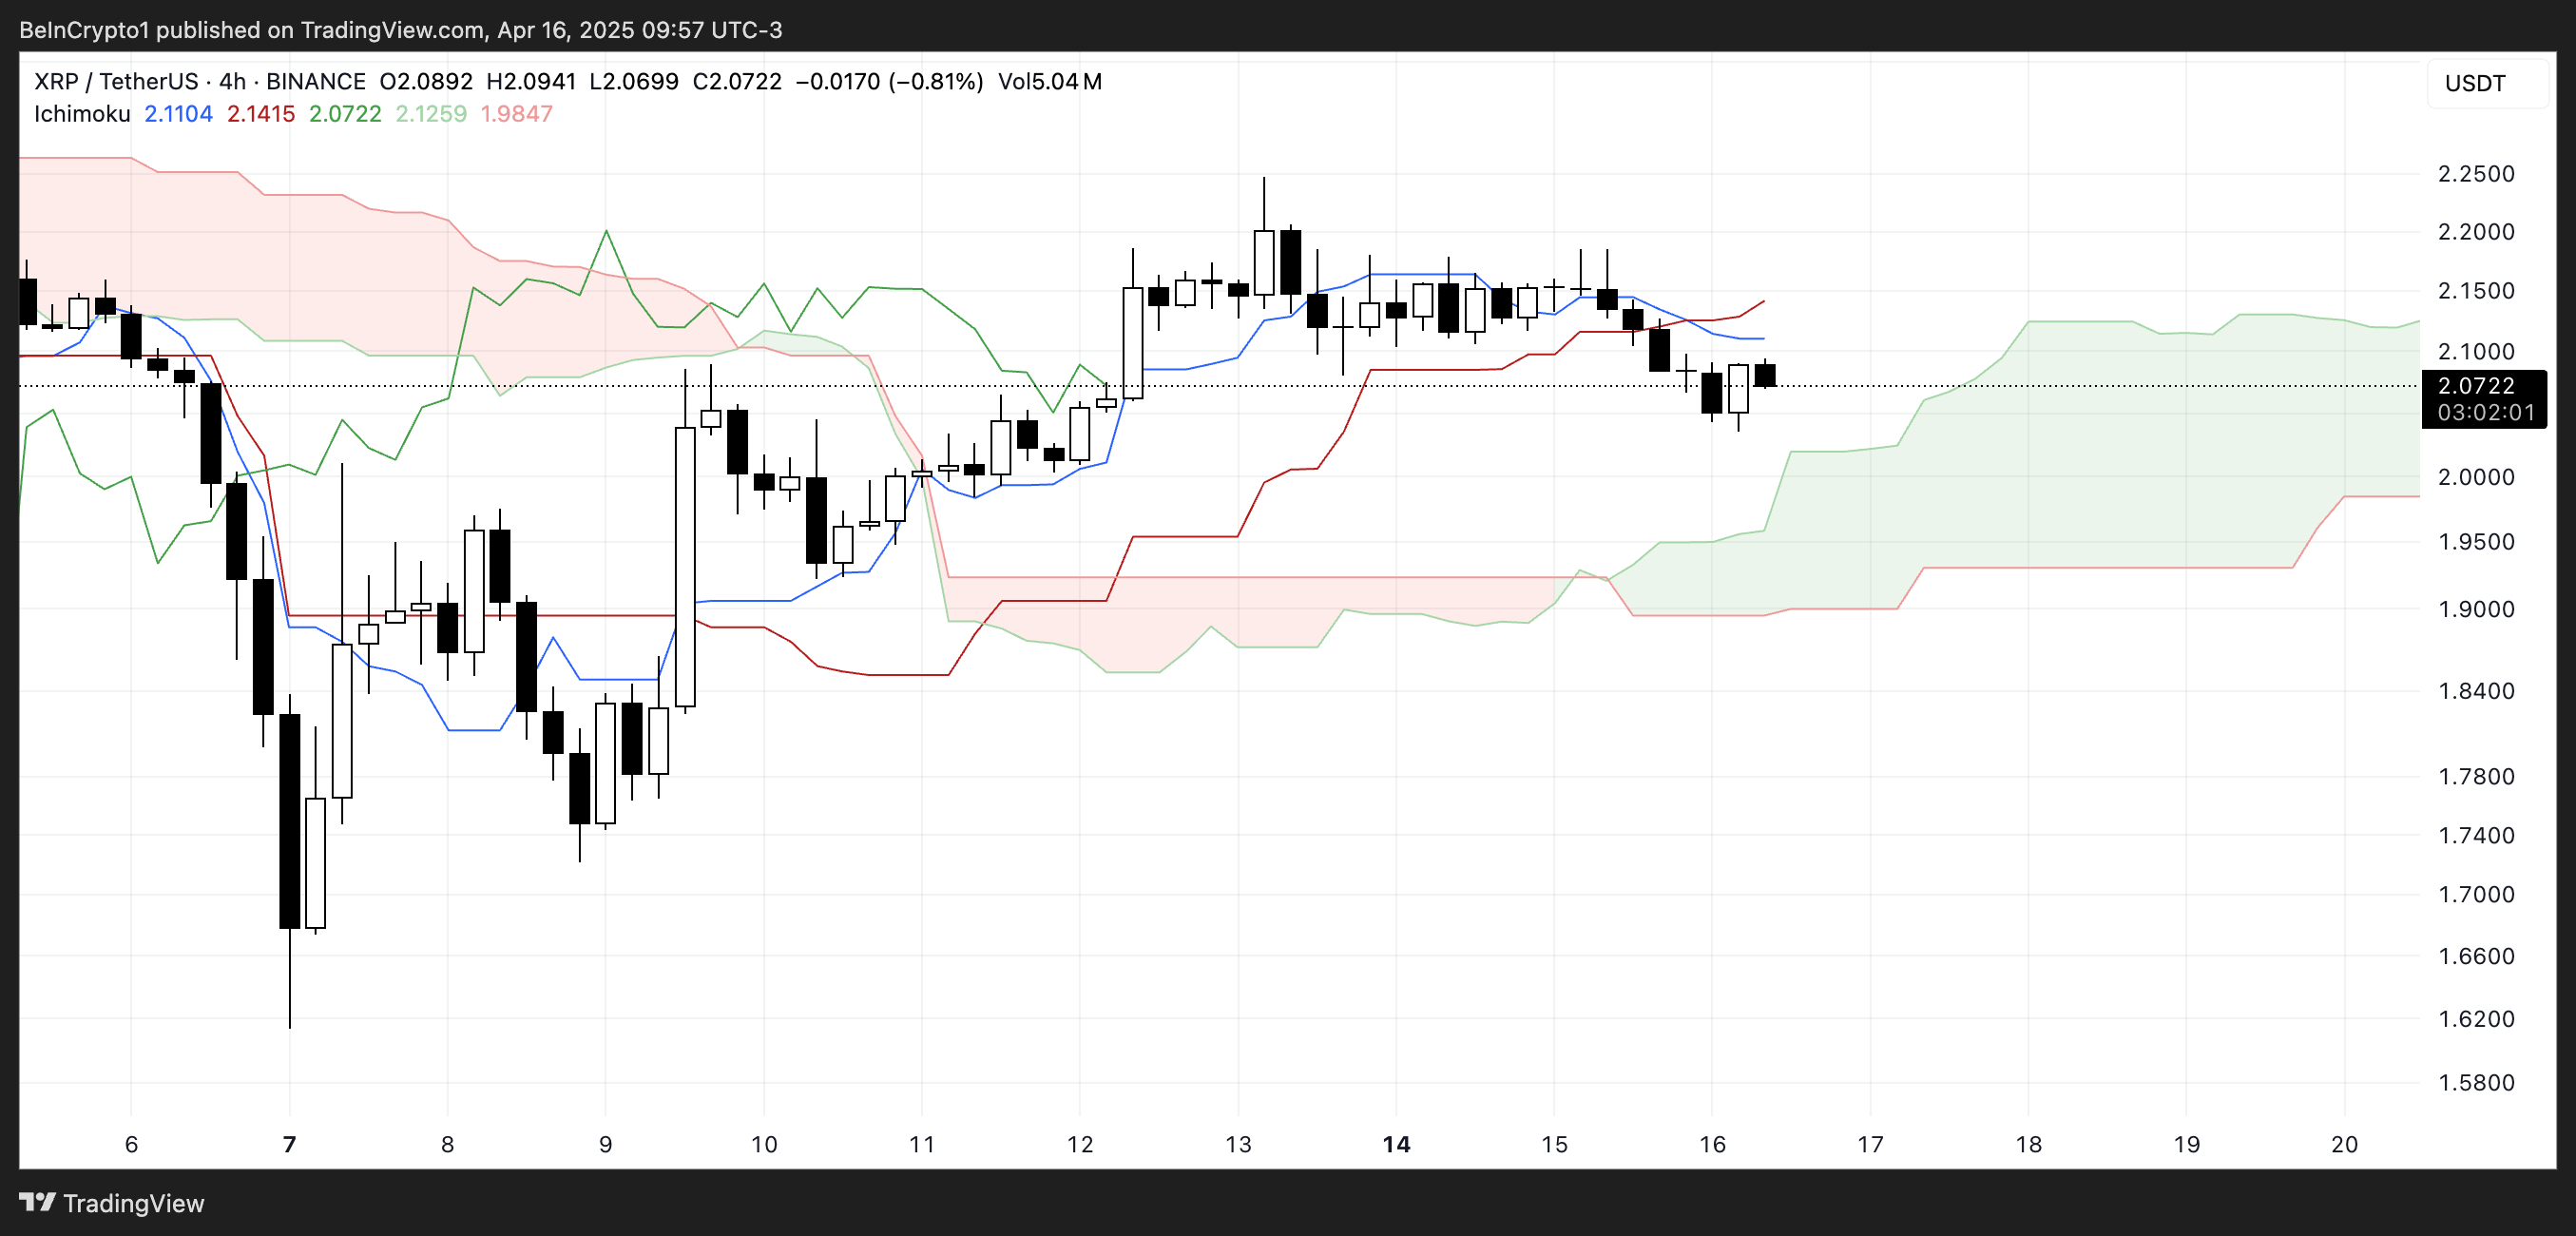
XRP’s Ichimoku Cloud chart currently shows a shift toward short-term bearish momentum.
The price has fallen below both the blue Tenkan-sen (conversion line) and the red Kijun-sen (baseline), which is typically viewed as a bearish signal.
When the price trades beneath these two lines, it often suggests weakening momentum and increasing downside risk unless a quick recovery follows.
 XRP Ichimoku Cloud. Source: TradingView.
Additionally, the price is now entering the green cloud (Kumo), which represents a zone of uncertainty or consolidation. The cloud ahead is relatively flat and wide, indicating potential support but also a lack of strong upward momentum.
The green Senkou Span A (leading span A) remains above the red Senkou Span B (leading span B), signaling that the broader trend is still slightly bullish—but if price action stays inside or breaks below the cloud, that trend may begin to reverse.
Overall, the Ichimoku setup points to caution for bulls unless XRP reclaims the Tenkan and Kijun lines convincingly.
EMA Lines Suggest XRP Could Fall Below $2
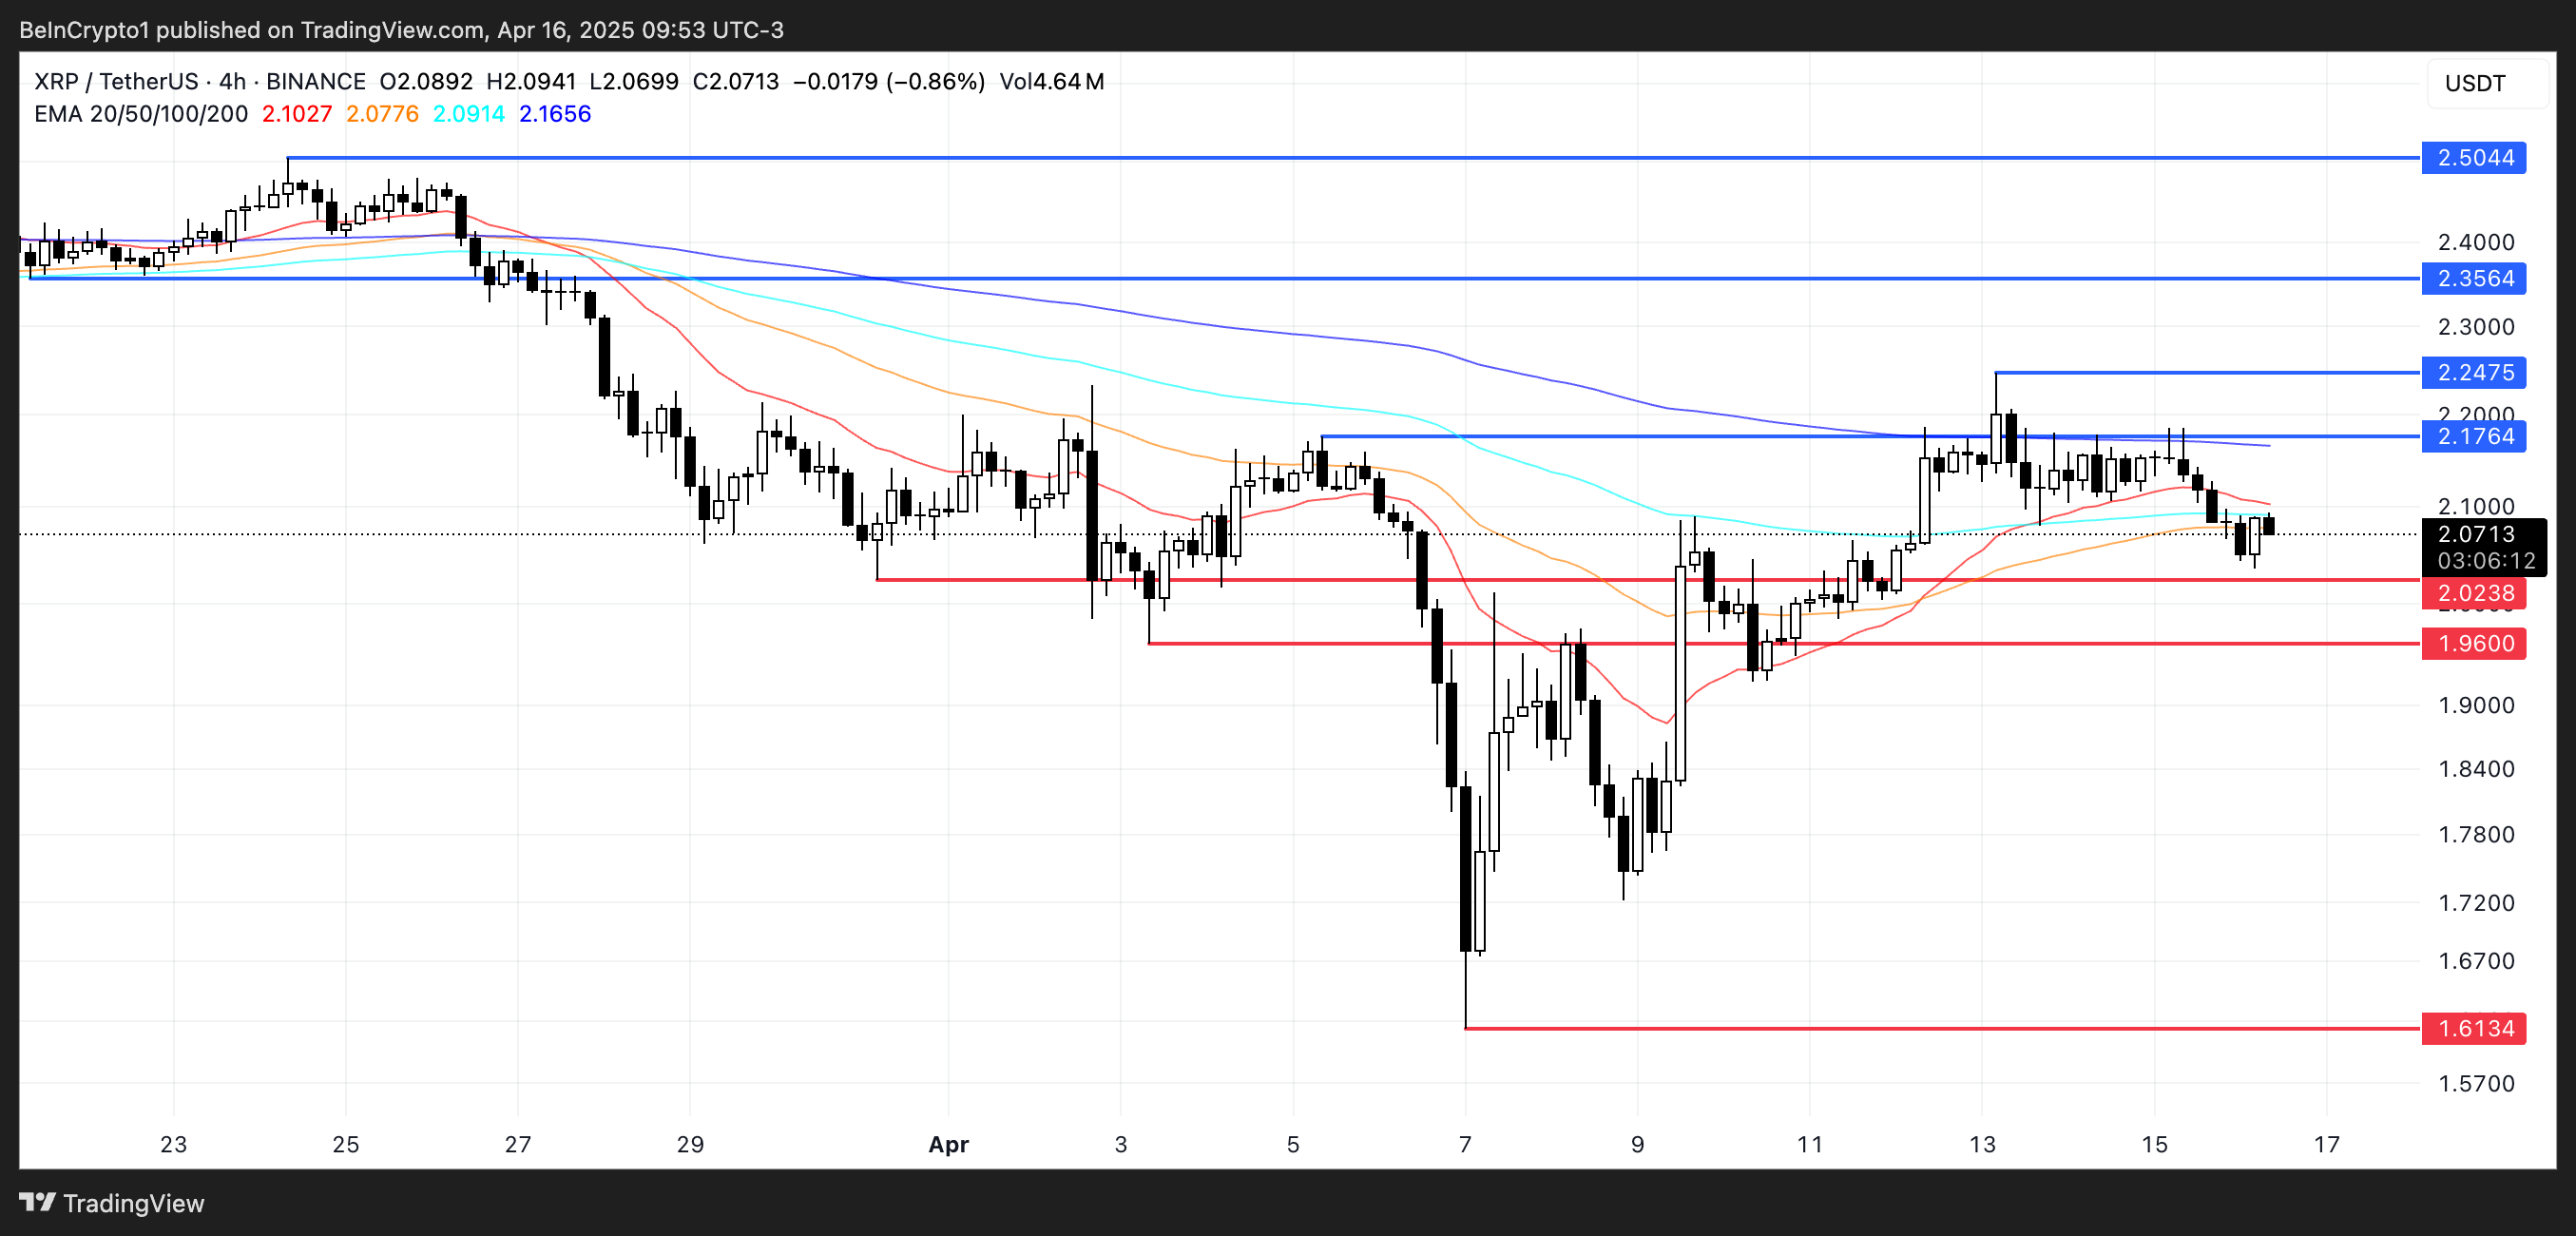
XRP’s EMA lines are showing signs of weakness, with XRP price repeatedly failing to break through the resistance near $2.17—even amid speculation about a potential partnership with Swift.
This repeated rejection at the same level indicates strong selling pressure. The EMAs suggest momentum is fading as the shorter-term average is beginning to bend downward.
 XRP Price Analysis. Source: TradingView.
A potential death cross, where the short-term EMA crosses below the long-term EMA, appears to be forming. If confirmed, it could signal a deeper correction ahead, with XRP possibly retesting support levels at $2.02 and $1.96.
A breakdown below these levels could lead to a drop toward $1.61. However, if bulls manage to reclaim $2.17, the next resistance at $2.24 becomes the key target.
A clean break above that could trigger a stronger rally, potentially pushing XRP to $2.35 or even $2.50 if momentum accelerates.
Read more
* The content presented above, whether from a third party or not, is considered as general advice only. This article should not be construed as containing investment advice, investment recommendations, an offer of or solicitation for any transactions in financial instruments.


