

XRP Loses Momentum After SEC Boost and Enters Consolidation Phase

- Iranian military drones targeted US Fifth Fleet in Bahrain in response to southern US strikes
- Gold Price Trend Forecast: US-Iran Peace Talks Drive Gold Rebound, Is the Gold Slump Over?
- Gold plummets below $4,200 as US‑Iran tensions spur hawkish rate bets ahead of US CPI
- SpaceX Listing Imminent. Funds Flood Into SpaceX On-Chain Tokens, Bitcoin Rebound Momentum May Be Weakened
- US May CPI Preview: Rising Inflation May Push Up Fed Rate Hike Expectations, How Will US Stocks, Dollar, Gold React?
- Gold Drops Below $4,300 Erasing Year-to-Date Gains. This Week’s CPI May Ignite Rate Hike Expectations Will Gold Still Rise in 2026?

XRP is up more than 8% over the past seven days, but it hasn’t been able to maintain the strong momentum sparked by the SEC dropping its lawsuit against Ripple.
After the initial surge, XRP has entered a phase of consolidation, with price action stuck between key support and resistance levels. Technical indicators now reflect a market on pause, with momentum fading and direction unclear.
XRP RSI Is Currently Neutral
XRP’s Relative Strength Index (RSI) is currently at 52.89, a notable drop from 63.90 just one day ago. This sharp decline signals a weakening in recent bullish momentum, as buyers appear to be losing control over the short term.
RSI has now slipped closer to neutral territory, suggesting that market participants are increasingly uncertain about the next move.
Importantly, XRP hasn’t reached RSI levels above 70—commonly associated with overbought and strongly bullish conditions—since March 19, over a week ago, indicating a lack of strong buying pressure during this period.
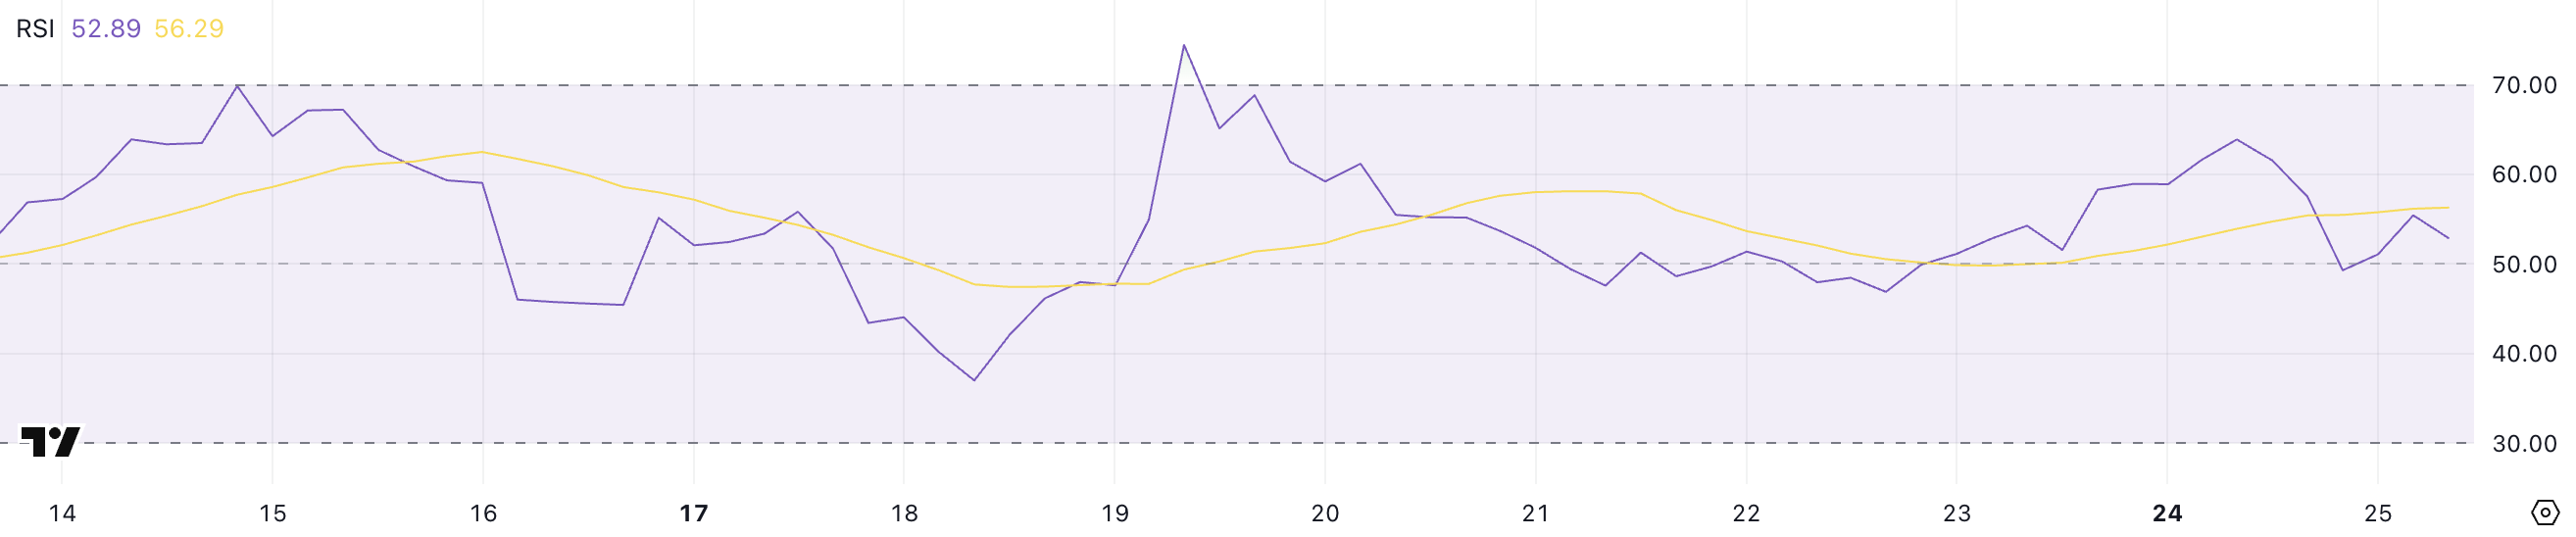 XRP RSI. Source: TradingView.
RSI, or Relative Strength Index, is a widely used momentum oscillator that measures the speed and change of price movements on a scale from 0 to 100.
An RSI reading above 70 typically signals that an asset is overbought and could be due for a pullback, while a reading below 30 suggests it may be oversold and primed for a bounce. Values between 50 and 70 generally reflect bullish momentum, whereas readings between 30 and 50 lean bearish.
With XRP now sitting at 52.89, it remains above the midpoint but is edging closer to neutral, suggesting the recent bullish phase may be cooling off unless renewed buying activity steps in.
Ichimoku Cloud Shows An Indecisive Market
XRP’s Ichimoku Cloud chart shows a market in consolidation, with price action hovering just above the cloud but lacking strong momentum.
The Tenkan-sen and Kijun-sen lines are relatively flat and close together, indicating a pause in trend strength and a balance between buyers and sellers.
The lack of a clear Tenkan/Kijun crossover also supports the idea that the market is in a neutral phase rather than trending decisively in either direction.
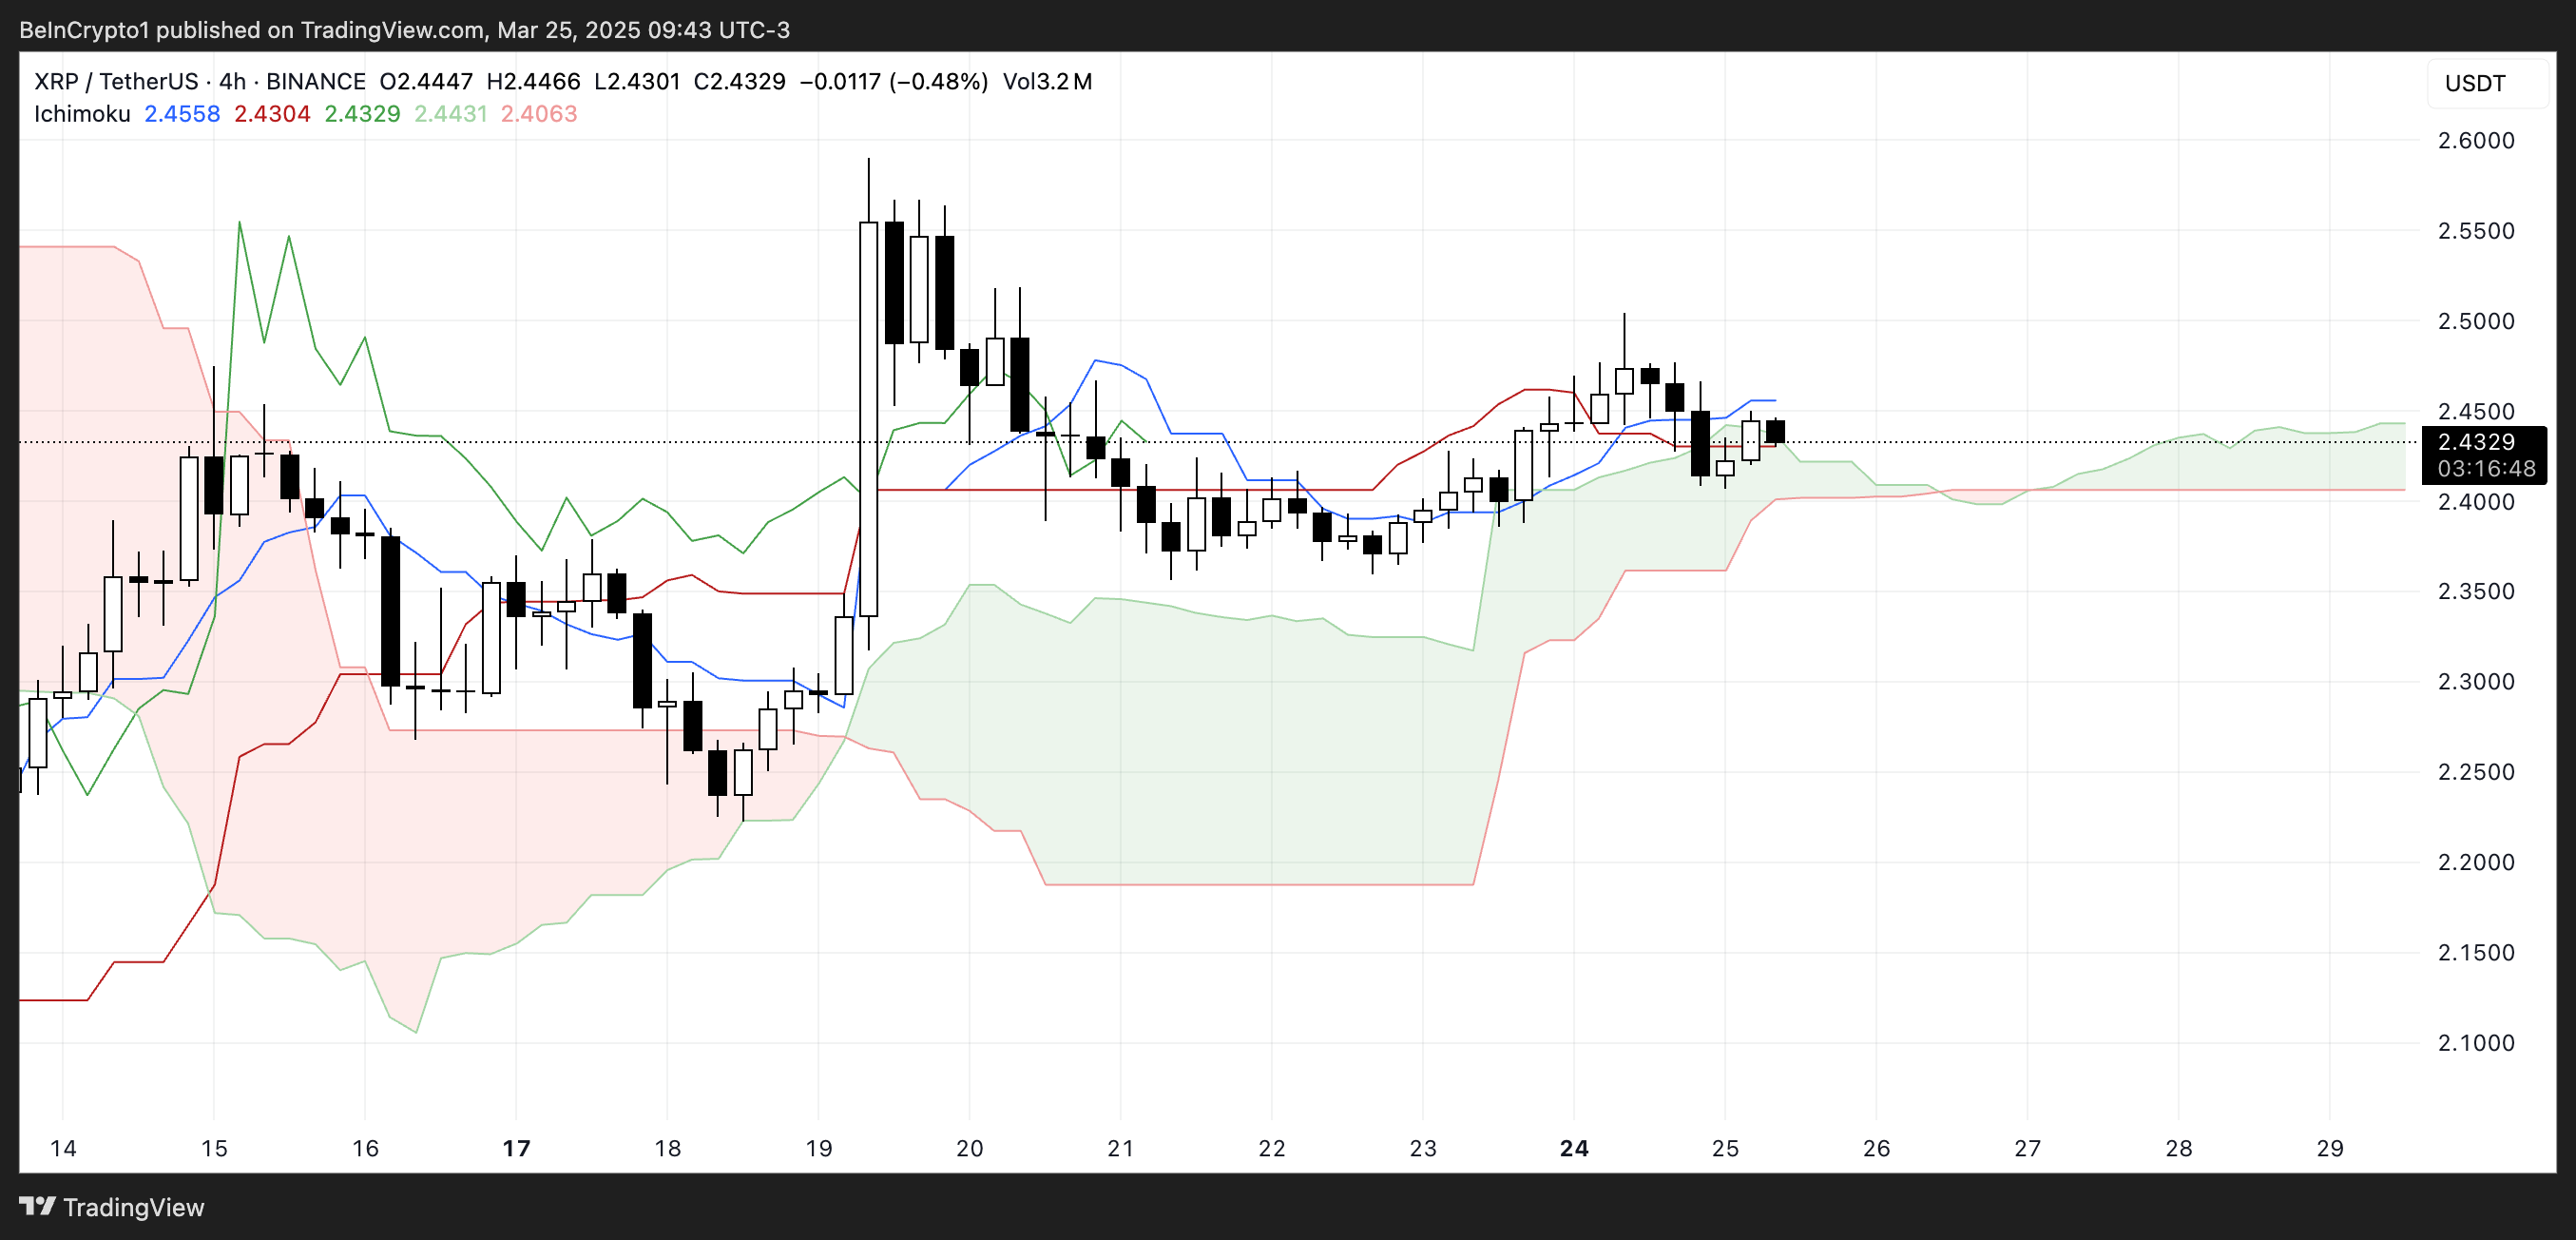 XRP Ichimoku Cloud. Source: TradingView.
The cloud ahead is thin and slightly bullish. This suggests that while there is some support beneath the price, it’s not particularly strong.
A thin cloud typically signals potential vulnerability, as it may not hold up well against increased selling pressure. Meanwhile, the Chikou Span (lagging line) is interacting closely with past price action, another sign that momentum is weakening.
Overall, the Ichimoku setup reflects uncertainty, with XRP needing a decisive push in either direction to escape this range-bound structure.
Will XRP Breach $2.50 Resistance?
XRP experienced a strong surge following the news that the SEC had dropped its case against it. However, that initial momentum has since cooled.
The price is now caught between a resistance zone at $2.47 and support at $2.35. That highlights a phase of consolidation and indecision.
If the current support level is retested and fails to hold, XRP could see increased selling pressure. That would open the door for a move down to $2.22. If bearish momentum intensifies, a deeper drop toward $1.90 is possible.
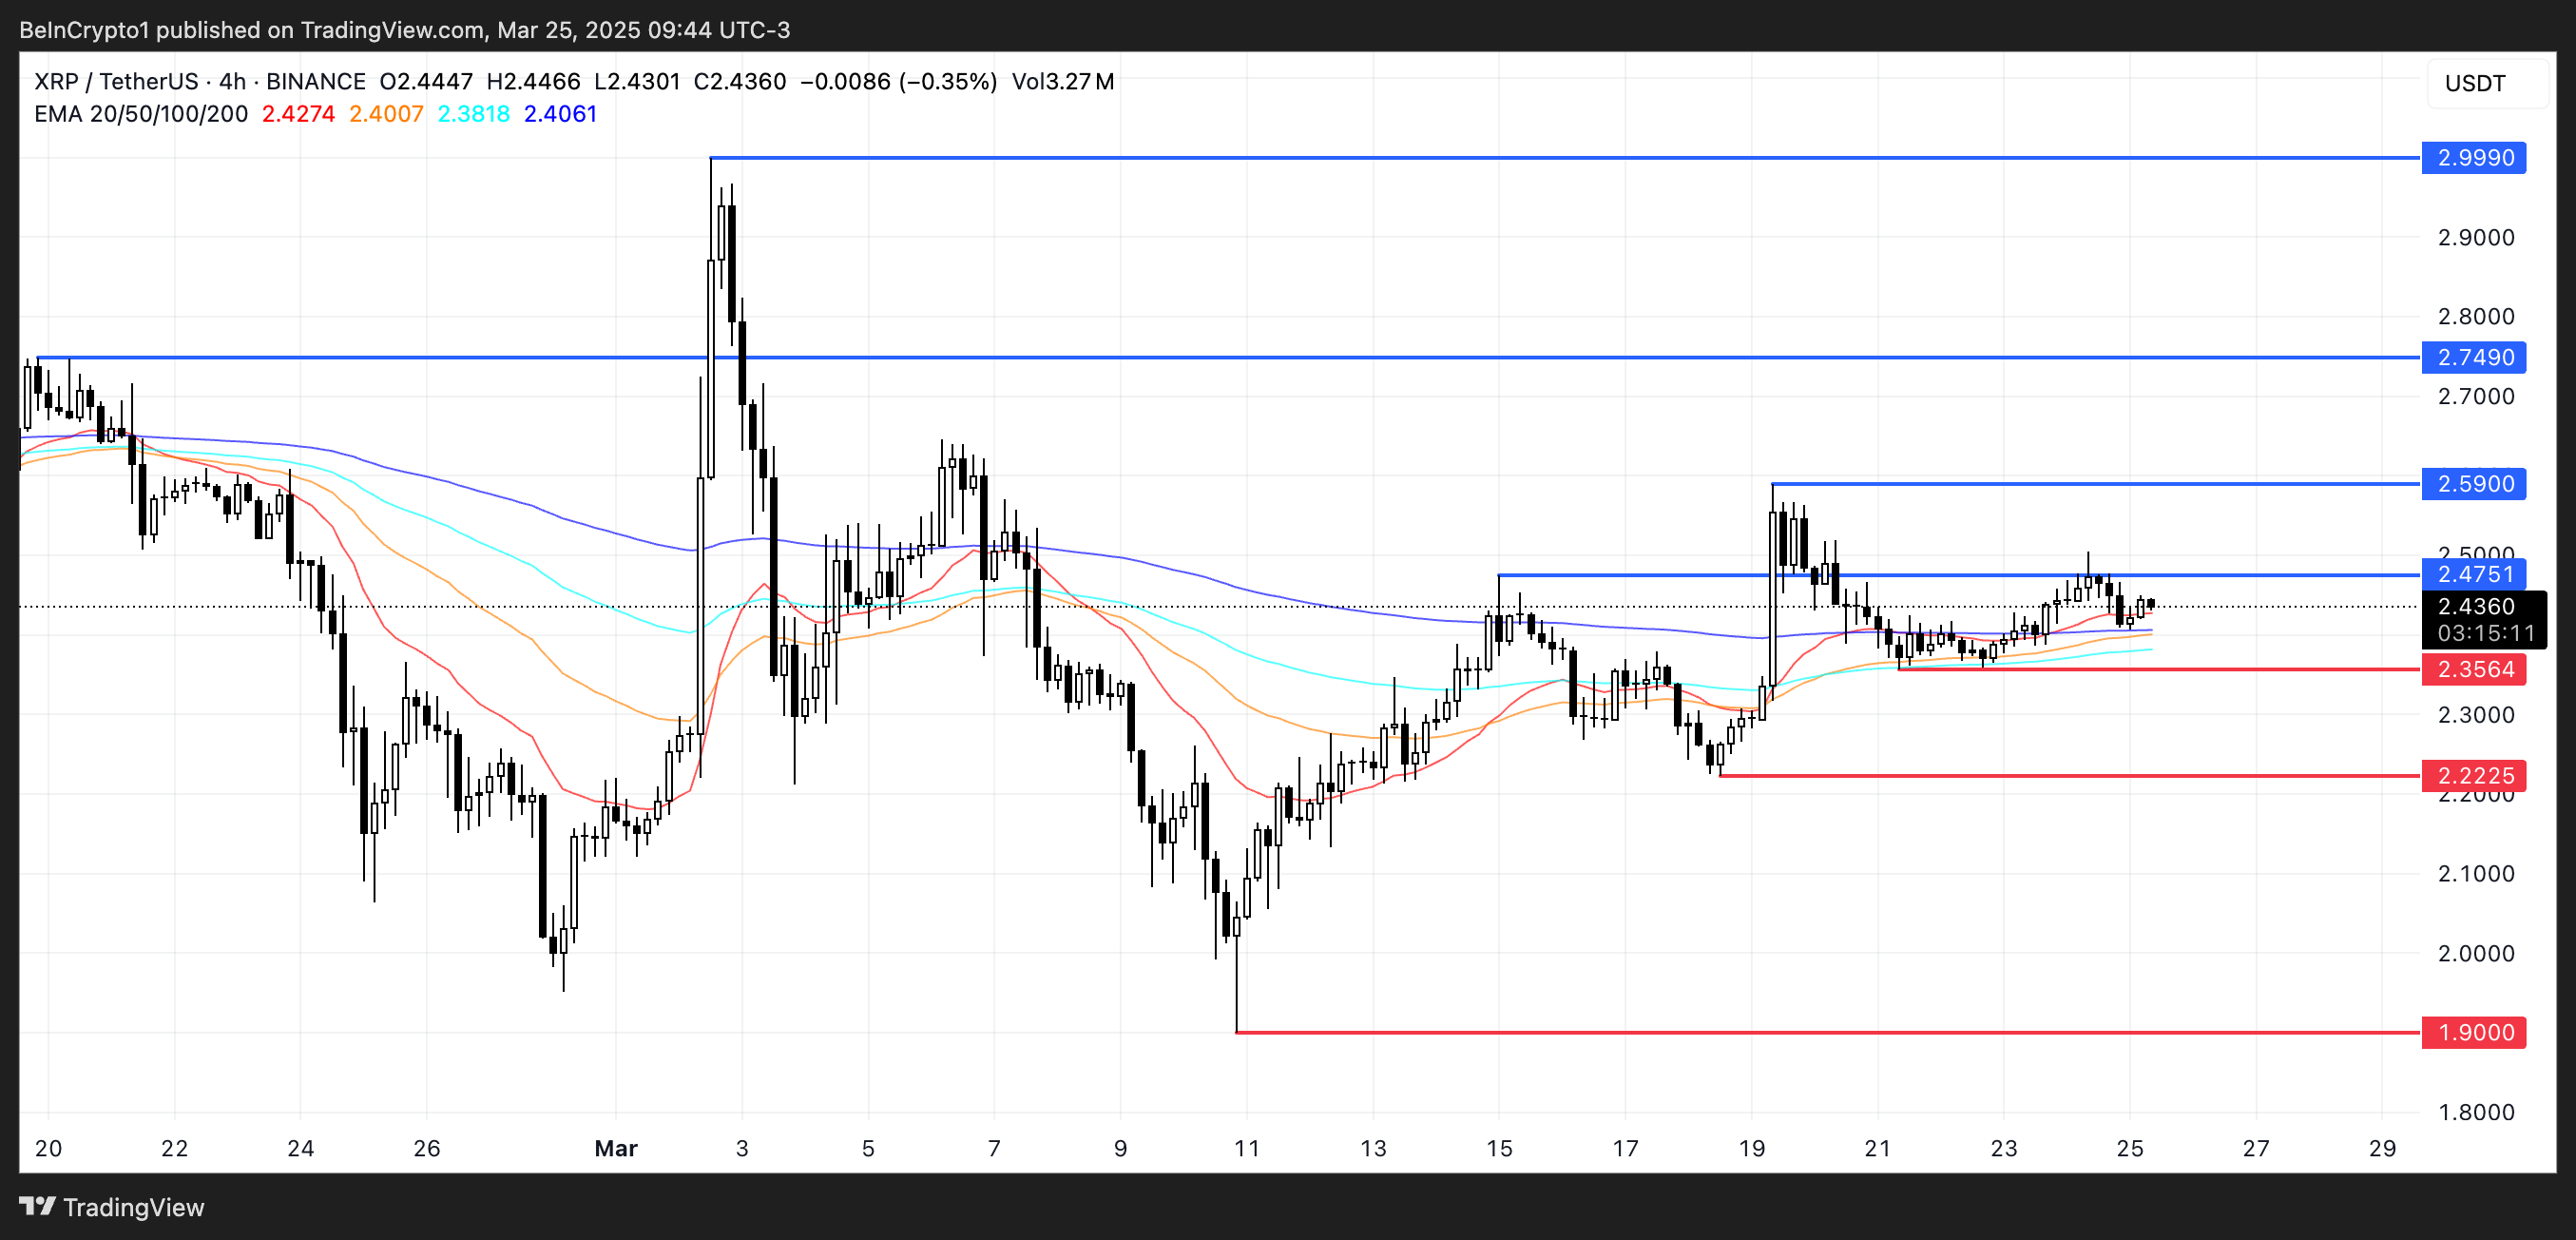 XRP Price Analysis. Source: TradingView.
On the flip side, if buyers can regain control and push XRP price above the $2.47 resistance.
The next targets in that scenario would be $2.59 and $2.749, both of which align with previous areas of rejection.
If the uptrend gathers strength, XRP could climb as high as $2.99.
Read more
* The content presented above, whether from a third party or not, is considered as general advice only. This article should not be construed as containing investment advice, investment recommendations, an offer of or solicitation for any transactions in financial instruments.


