


Shiba Inu Price Forecast: SHIB holders unload 61.5 billion tokens in the last ten days

- Bitcoin Drops to $70,000. U.S. Government Refuses to Bail Out Market, End of Bull Market or Golden Pit?
- Gold rallies further beyond $5,050 amid flight to safety, dovish Fed expectations
- Bitcoin Bottom Debate: $70,000 or $50,000?
- A Crash After a Surge: Why Silver Lost 40% in a Week?
- Bitcoin Slips Below 75,000 Mark. Will Strategy Change Its Mind and Sell?
- Bitcoin Rout. Bridgewater Founder Dalio Publicly Backs Gold.
Shiba Inu price hovers around $0.000013 on Tuesday after dropping nearly 12% the previous day.
Supply Distribution data shows that whale wallets have decreased SHIB holdings in the last ten days.
The technical outlook suggests a further correction targeting the $0.000010 level.
Shiba Inu (SHIB) price is hovering around $0.000013 on Tuesday after dropping nearly 12% the previous day. Supply Distribution data shows that whale wallets have decreased SHIB holdings in the last ten days, while its technical outlook suggests a deeper correction targeting the $0.000010 level.
Whale wallets lower SHIB holdings
Santiment Supply Distribution data showed that whale wallets decreased SHIB holdings by 61.5 billion in the last ten days. The metric reflected that whales holding SHIB tokens between 100,000 and 1 million dropped from 139.16 billion on February 16 to 137.64 billion on Tuesday.
During the same period, wallets holding 1 million to 10 million and 10 million to 100 million also decreased from 2.07 trillion to 2.03 trillion and 9.41 trillion to 9.39 trillion, respectively. This development shows that the whales are unloading their bags and increasing the selling pressure, adding a bearish outlook for Shiba Inu.
 [09.36.39, 25 Feb, 2025]-638760590295534237.png)
SHIB Supply Distribution Chart. Source: Santiment
Shiba bears target $0.000010 mark
Shiba Inu price broke and closed below its ascending trend (drawn from connecting multiple lows since August 5) on January 24 and declined nearly 25% in a month. On Monday, at the start of this week, it declined by 11.77%. When writing on Tuesday, it hovers around $0.000013 level.
If SHIB continues its pullback, it could extend its decline to test the August 5 low of $0.000010.
The daily chart's Relative Strength Index (RSI) indicator reads 32, indicating strong bearish momentum still out of oversold levels.
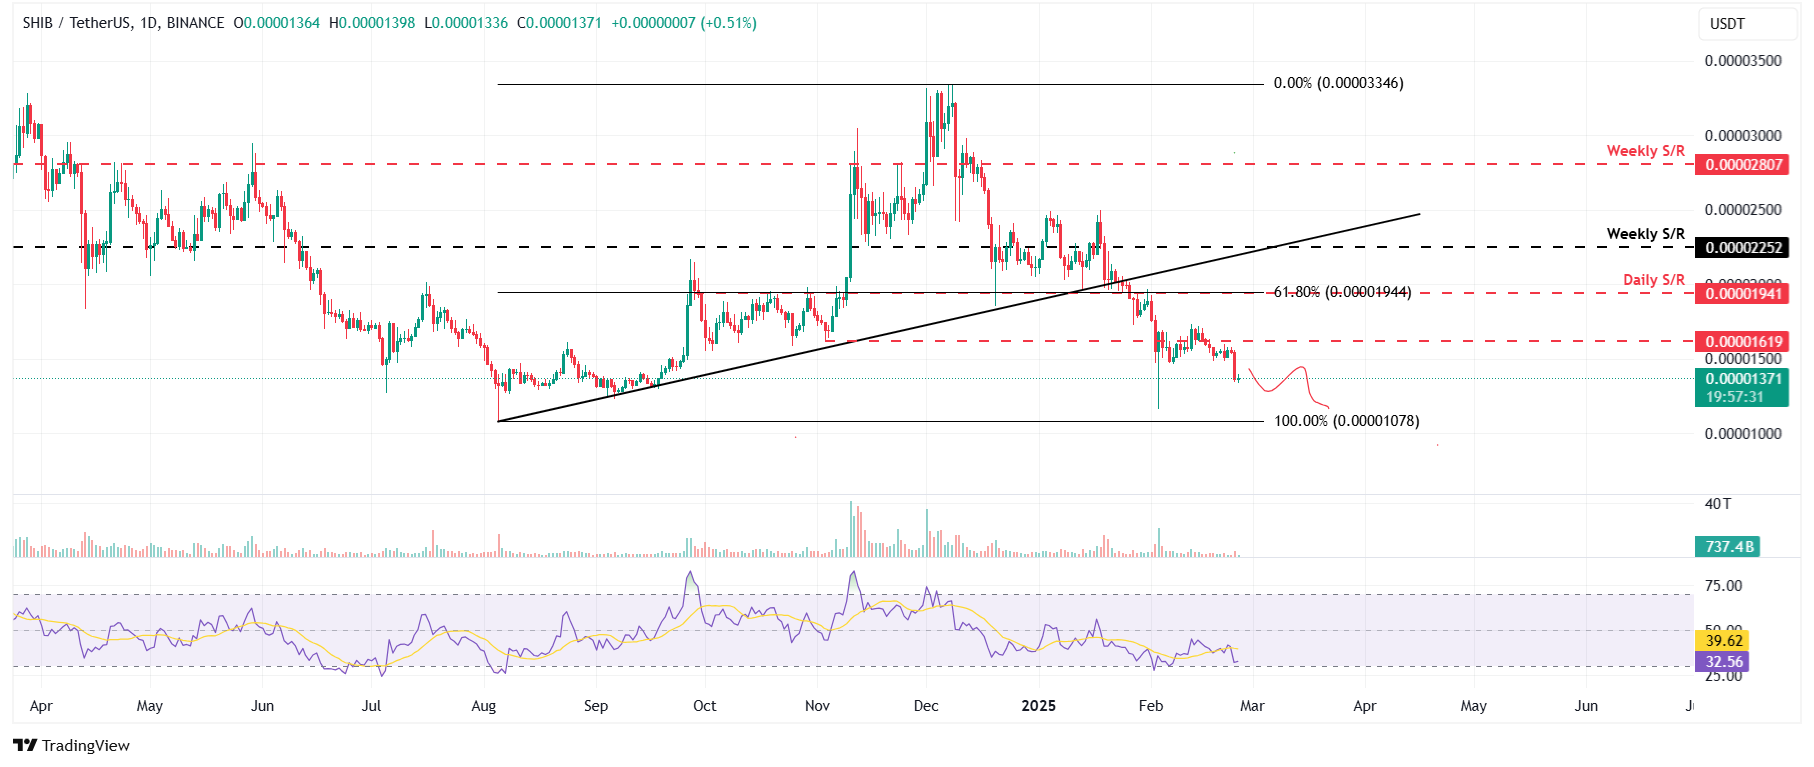
SHIB/USDT daily chart
Read more
* The content presented above, whether from a third party or not, is considered as general advice only. This article should not be construed as containing investment advice, investment recommendations, an offer of or solicitation for any transactions in financial instruments.


