


Arbitrum could face 20% correction as ARB upside looks capped


Arbitrum price has flipped a key support zone extending from $1.67 to $1.79 into resistance.
A rebound into this zone could be likely before ARB faces a 20% correction to $1.34.
On-chain metrics support this potential downward trajectory.
Arbitrum (ARB) price has breached its consolidation phase that existed for the most part of January, February and March, signaling the start of a potential downtrend after the March second-week crash. During this descent, ARB flipped a key support level into a resistance level, confirming an extension of the downtrend.
Arbitrum price in an uphill battle
Arbitrum price has broken below the $1.79 and $1.67 support levels, starting on the March 16 crash. Since then, ARB has shed 24% and currently trades at $1.48. Usually, a breakdown of key support is followed by a retest, which confirms the flip of this level into resistance.
If such a development were to follow, investors could expect Arbitrum price to trigger a 13% to 20% upward move that retests the aforementioned resistance zone. If sellers are in control, then ARB will most likely face intense rejection that pushes it down to the next key support level at $1.34, which is roughly 20% down from $1.67.
The Relative Strength Index (RSI) and Awesome Oscillator (AO) support this downward move as they hover below their respective mean levels of 50 and 0.
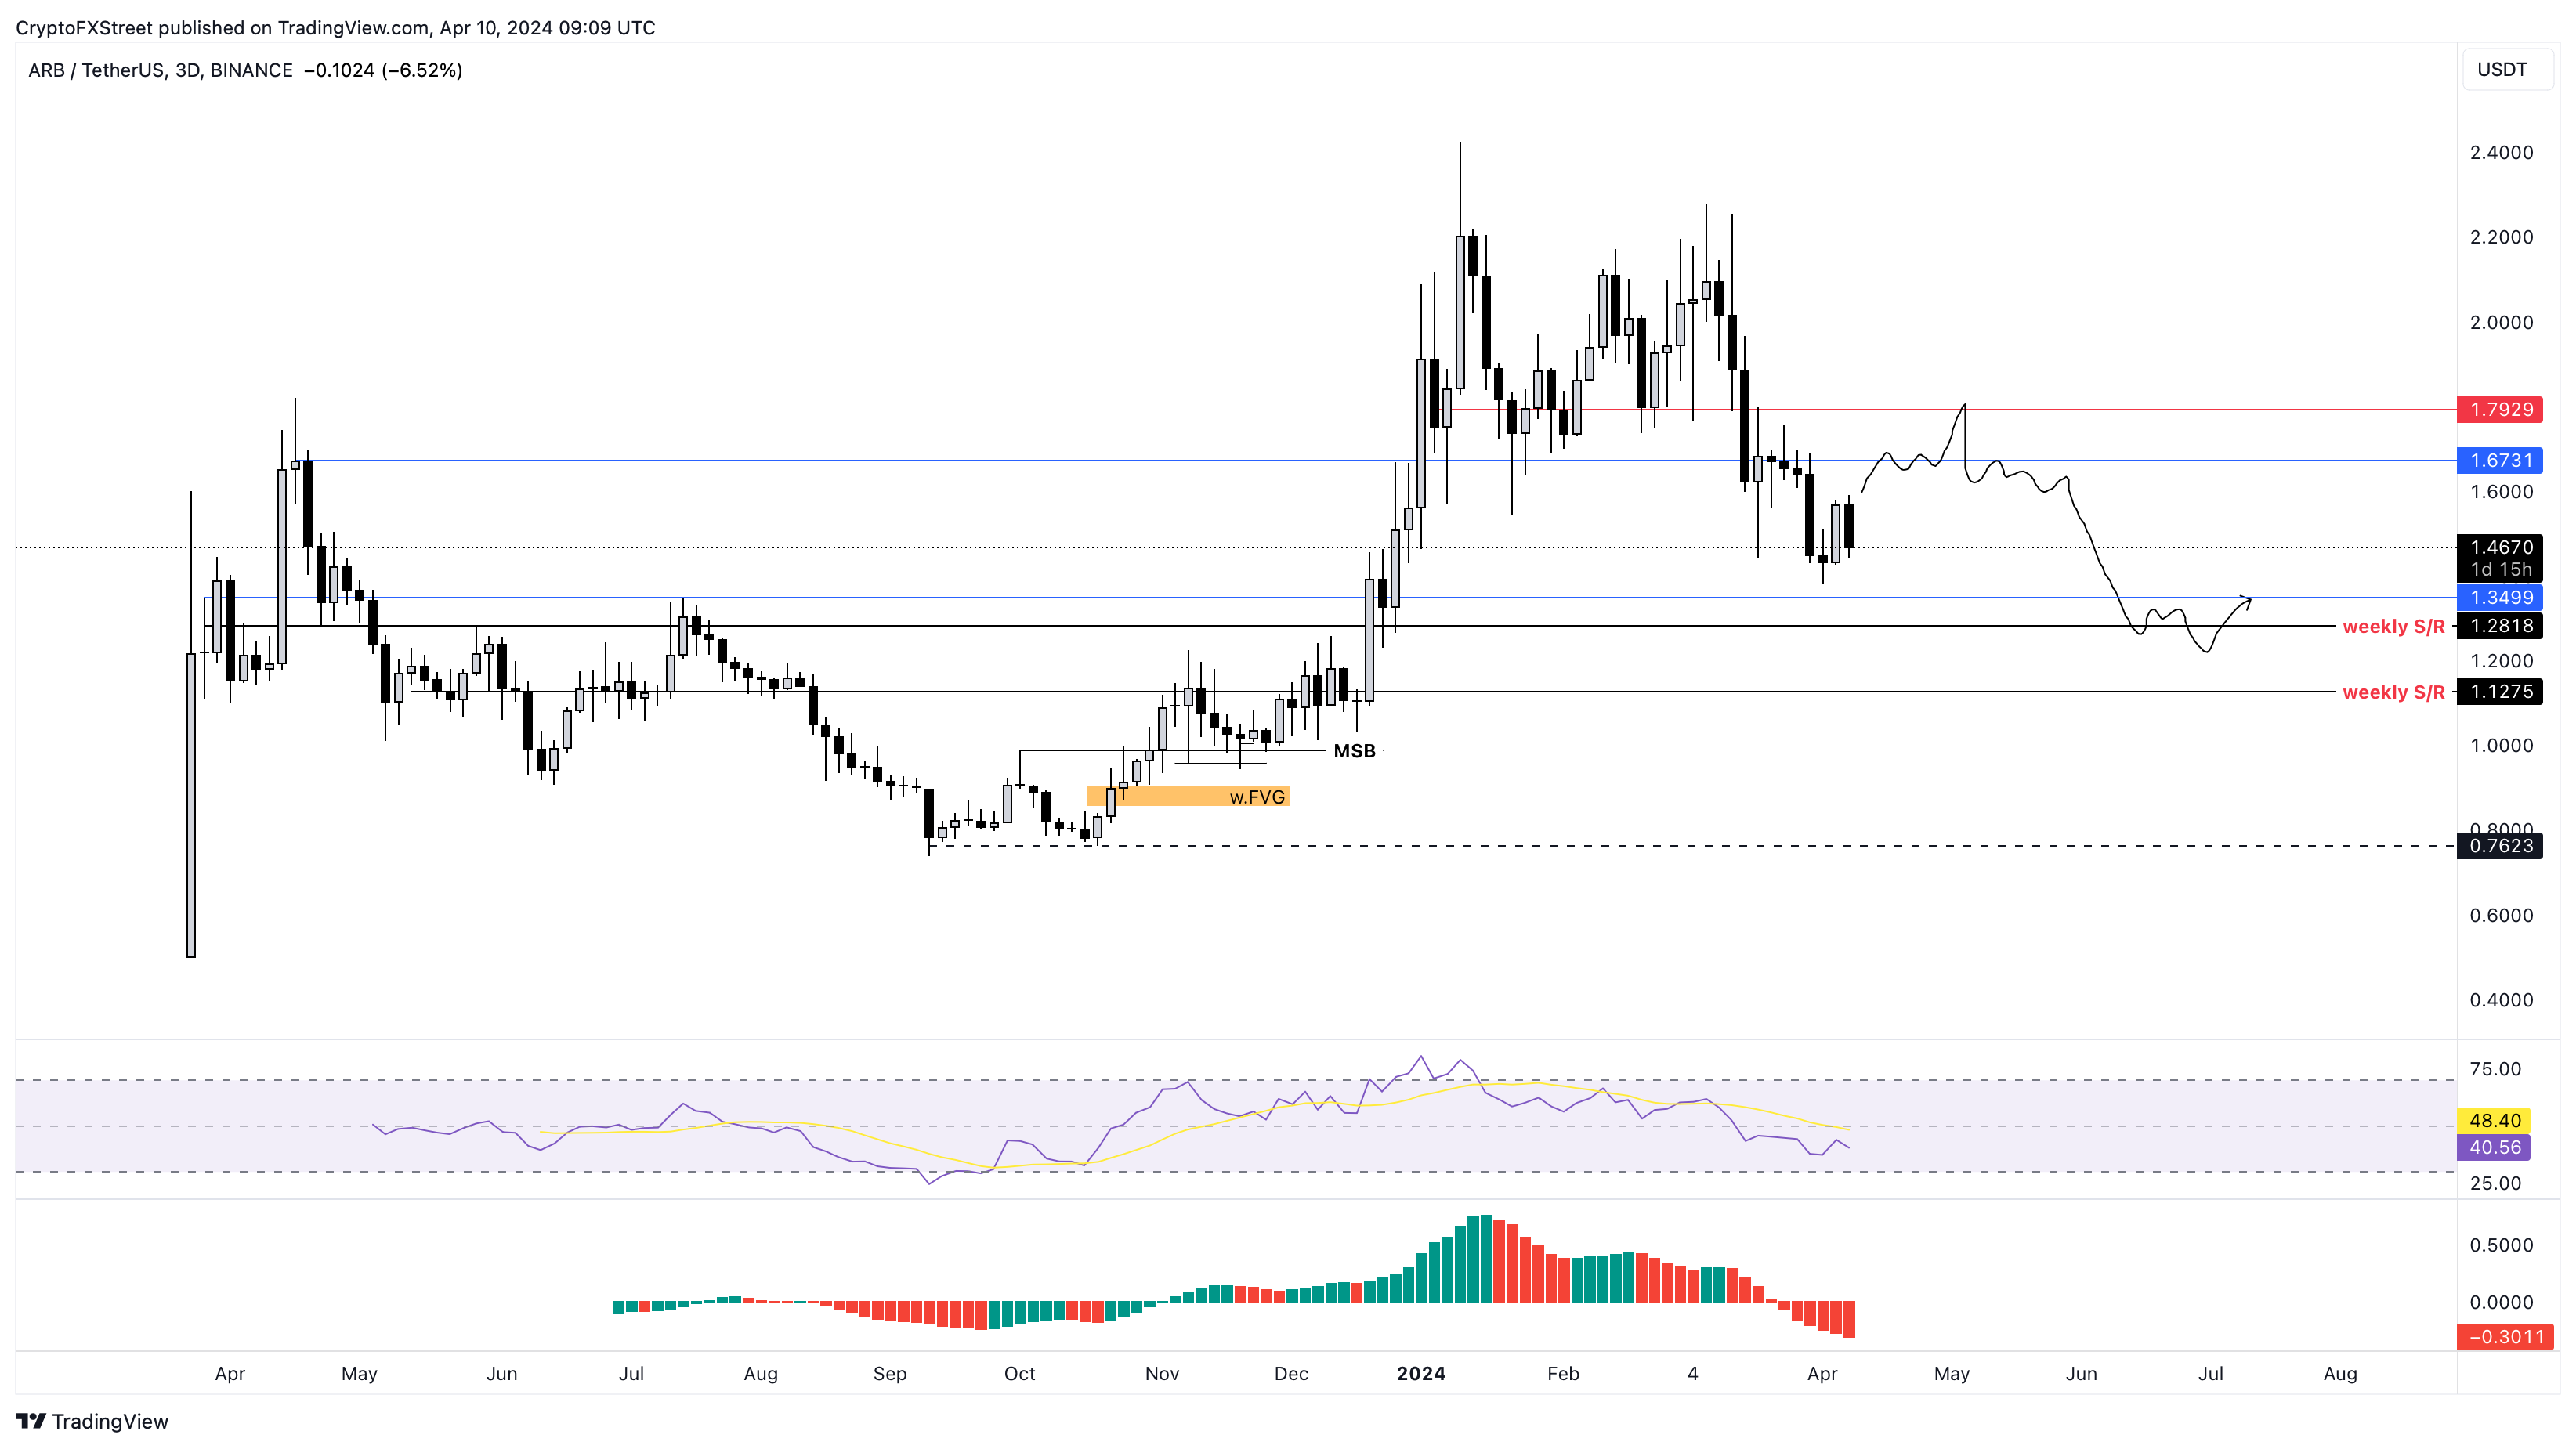
ARB/USDT 3-day chart
Furthermore, IntoTheBlock’s data shows that 175,000 addresses that purchased 895 million ARB at an average price of $1.65 are Out of the Money. These investors accumulated ARB between $1.58 and $1.70, which coincides with the resistance level noted from a technical perspective.
Between $1.36 and $1.45, roughly 56,400 addresses bought 2.15 billion ARB at an average price of $1.41. These investors are still in In the Money and are likely to accumulate more should Arbitrum price slide lower. Interestingly, this level also coincides with the technical support noted above.

ARB GIOM
On the other hand, if Arbitrum price reconquers the $1.79 resistance level and flips it into a support floor, it would invalidate the bearish thesis. In such a case, ARB could attempt a 12% move to the $2 psychological level.
Read more
* The content presented above, whether from a third party or not, is considered as general advice only. This article should not be construed as containing investment advice, investment recommendations, an offer of or solicitation for any transactions in financial instruments.


