


Hedera (HBAR) price has been consolidating over the past few weeks, with a modest 3.8% increase in the last seven days. The token is striving to maintain its market cap above $11.5 billion as market momentum shows signs of weakening.
While HBAR remains in an uptrend, mixed signals from technical indicators suggest the potential for either a continued rally or a reversal. Traders are watching closely to see whether HBAR can break above key resistance levels or if it will test lower support zones.
Hedera Remains in an Uptrend, but a Shift May Be Near
The Average Directional Index (ADX) for Hedera is currently at 35.9, reflecting strong trend strength, although slightly down from 37.7 a few hours ago. The ADX measures the strength of a trend on a scale of 0 to 100, with values above 25 indicating a strong trend and values below 20 signaling weak or absent momentum.
The current level suggests that HBAR price is still experiencing a strong uptrend, though the slight decline in ADX hints at a potential easing in momentum.
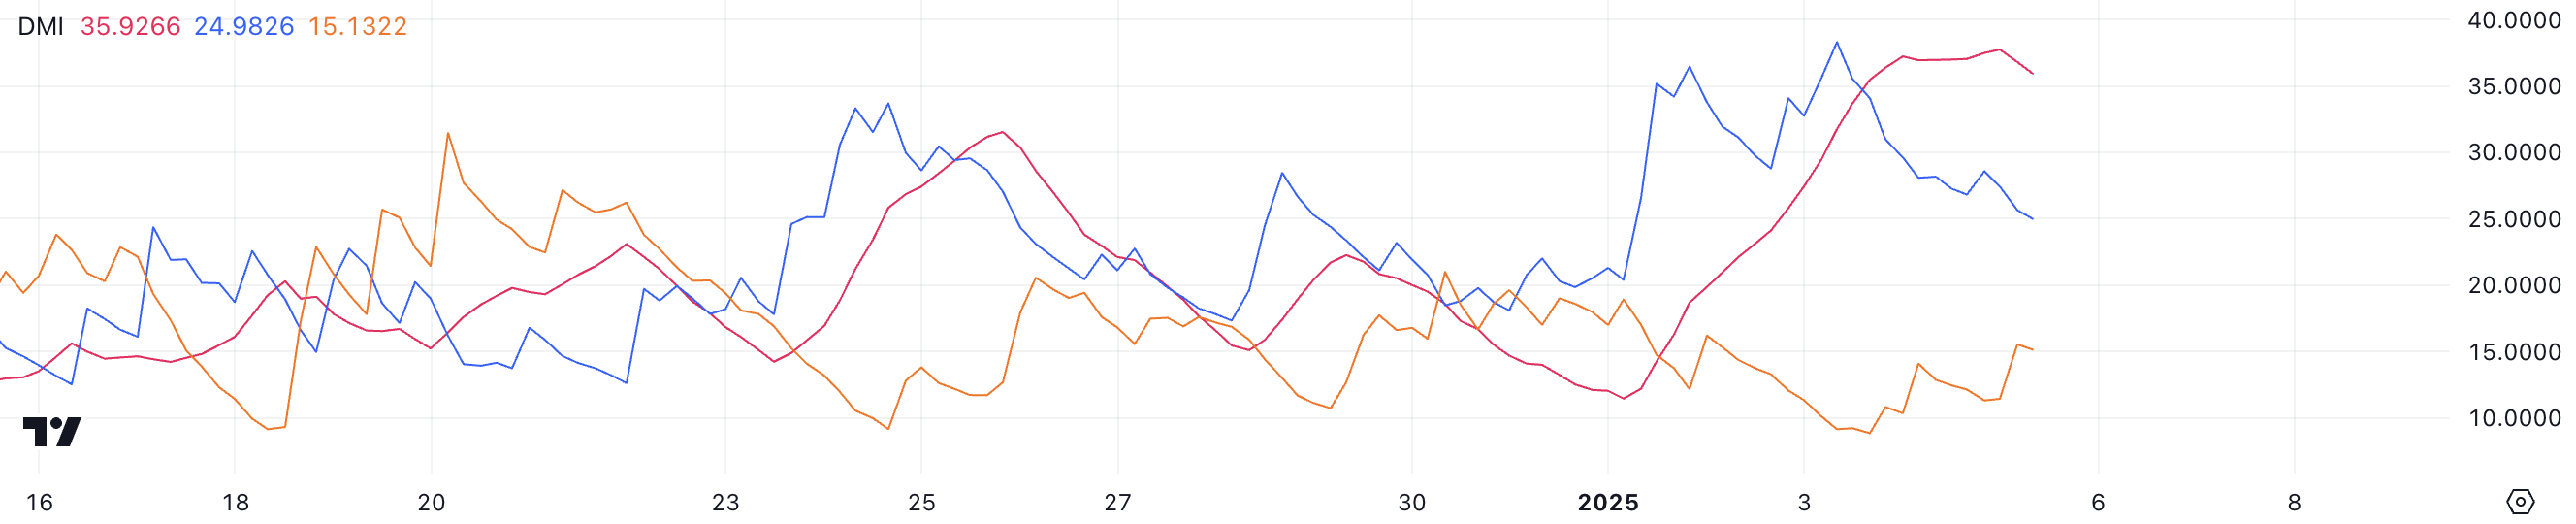 HBAR DMI. Source: TradingView
The directional indicators provide additional context, with the +DI at 24.9, down from 38.2 two days ago, and the -DI at 15.1, up from 9.1 over the same period. This indicates that while buying pressure remains dominant, it has weakened significantly, and selling pressure is beginning to rise.
If this trend continues, the uptrend may lose steam. HBAR could enter a consolidation phase or even a potential downtrend unless renewed buying activity strengthens the +DI and stabilizes the ADX.
HBAR Ichimoku Cloud Shows Mixed Signs
The Ichimoku Cloud chart for Hedera currently reflects a mixed setup. The price is trading near the red cloud, signaling a period of uncertainty as the market struggles to establish a clear direction.
While the green cloud ahead suggests potential bullish momentum, the price’s position near the red cloud indicates the need for further confirmation to solidify the uptrend.
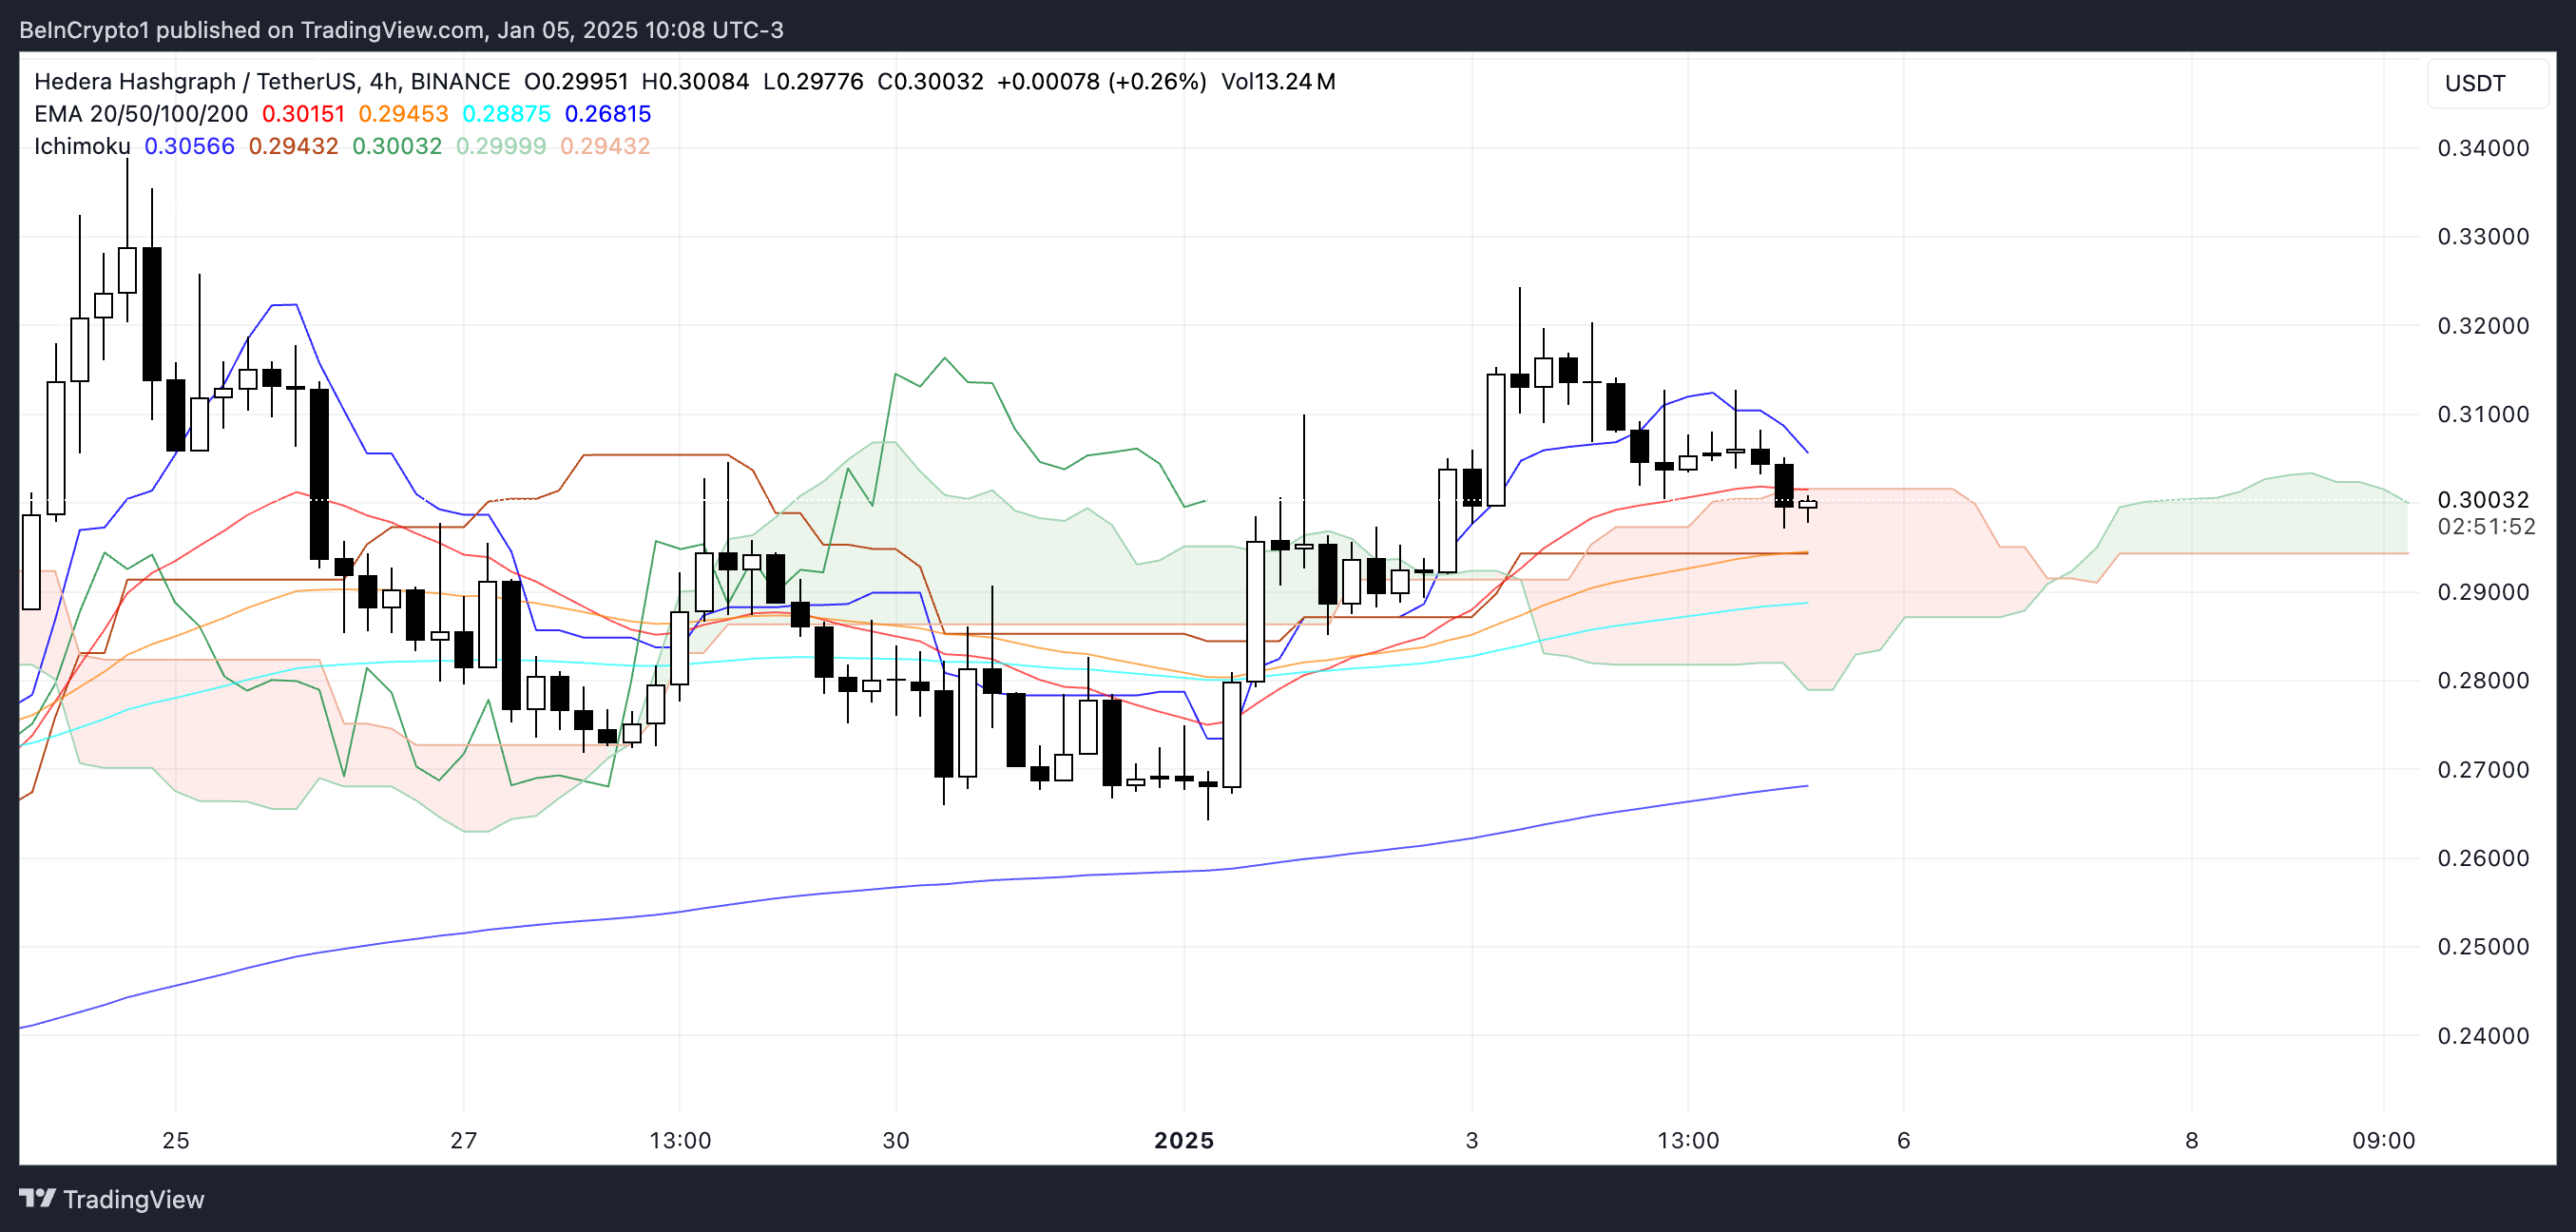 HBAR Ichimoku Cloud. Source: TradingView
The blue Tenkan-sen (conversion line) is trending downward and has moved closer to the orange Kijun-sen (baseline), indicating weakening short-term momentum.
For HBAR price to regain its upward trajectory, it must move decisively above the cloud and maintain its position. Conversely, if the price breaks below the cloud, this could signal a bearish shift, potentially leading to further declines.
HBAR Price Prediction: Will Hedera Fall Back to $0.23 In January?
HBAR price is currently consolidating between a key support level of $0.274 and a resistance of $0.311. It formed a golden cross a few days ago, but HBAR price wasn’t able to break the resistance around $0.32.
If the ongoing uptrend regains its strength and successfully breaks above the $0.311 resistance, Hedera could see further upward momentum, potentially testing the next resistance at $0.338.
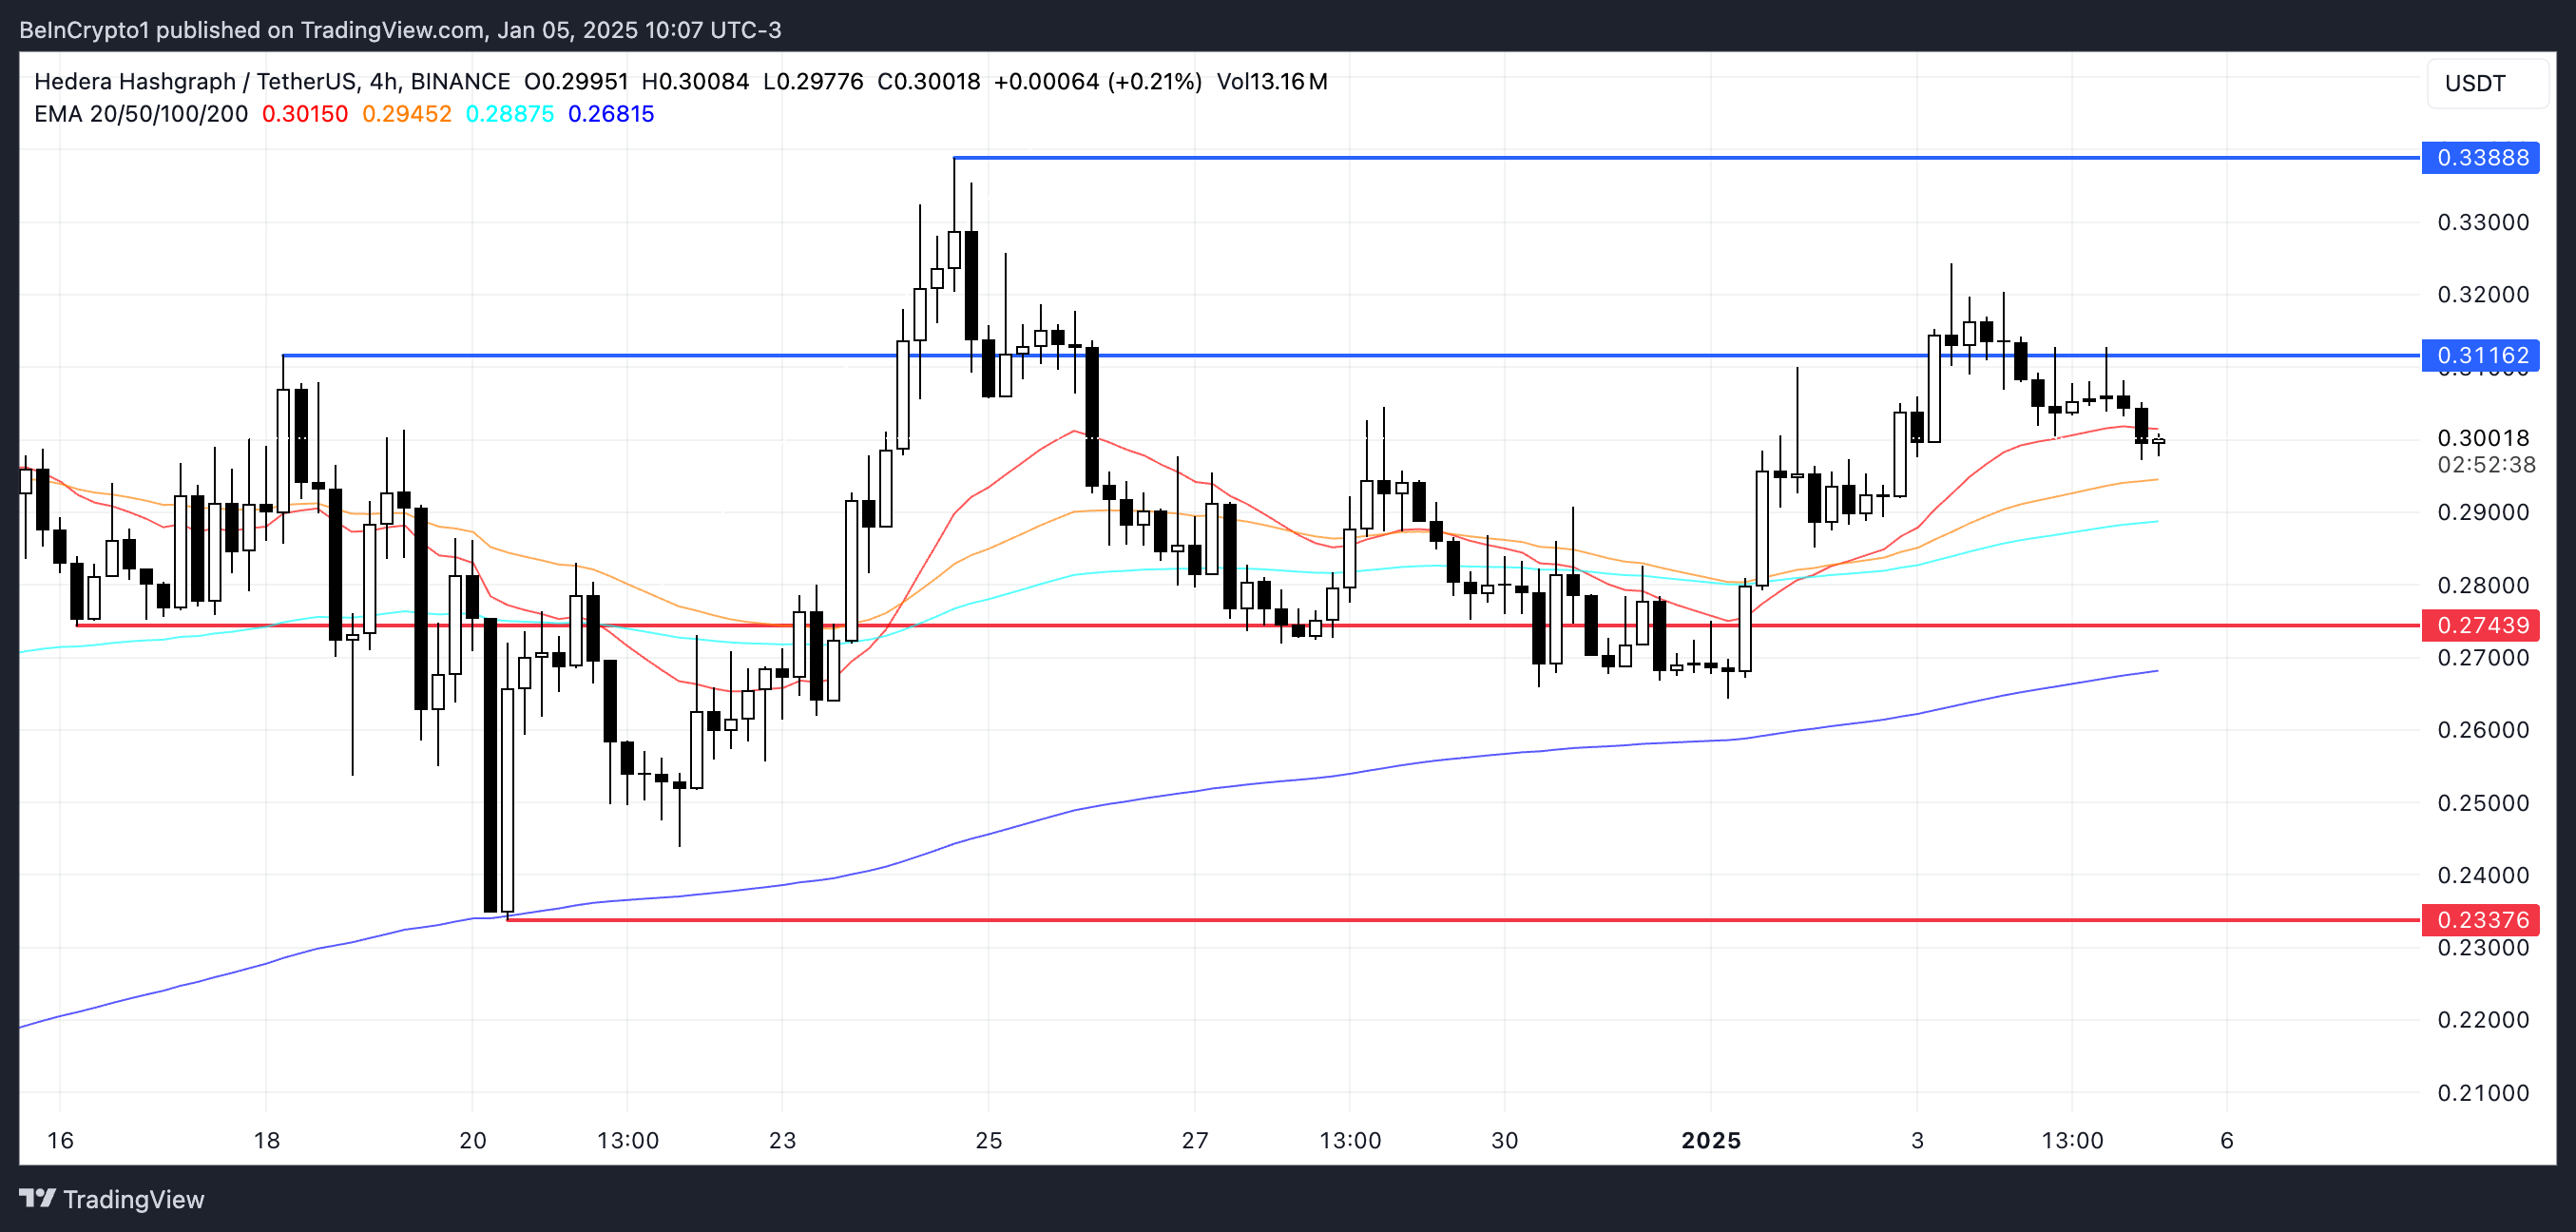 HBAR Price Analysis. Source: TradingView
However, if the $0.274 support fails to hold, the current trend could reverse into a downtrend. In such a scenario, the HBAR price may face additional selling pressure, pushing it down to retest the next support level at $0.233.
* The content presented above, whether from a third party or not, is considered as general advice only. This article should not be construed as containing investment advice, investment recommendations, an offer of or solicitation for any transactions in financial instruments.


