


Pudgy Penguins (PENGU) Price Surges With Volume Up 150% in 24 Hours

- Bitcoin Drops to $70,000. U.S. Government Refuses to Bail Out Market, End of Bull Market or Golden Pit?
- Gold rallies further beyond $5,050 amid flight to safety, dovish Fed expectations
- Bitcoin Bottom Debate: $70,000 or $50,000?
- A Crash After a Surge: Why Silver Lost 40% in a Week?
- Bitcoin Slips Below 75,000 Mark. Will Strategy Change Its Mind and Sell?
- Bitcoin Rout. Bridgewater Founder Dalio Publicly Backs Gold.
Pudgy Penguins (PENGU) price has surged over 9% in the last 24 hours, with trading volume soaring 150% to reach $907 million. Now the second-largest Solana meme coin behind BONK, PENGU is attracting significant attention as its market cap climbs to $2 billion.
Despite a recent RSI surge and bullish momentum reflected in the DMI, the trend strength remains modest, signaling cautious optimism among traders. The altcoin s approaching critical resistance at $0.043, with potential for further gains or a sharp correction depending on whether the current momentum sustains or reverses.
PENGU RSI Spikes but Remains in Neutral Zone
PENGU Relative Strength Index (RSI) is currently at 51, reflecting a slight decline from yesterday’s 57 after surging from 35 in less than a day. This movement indicates that while buying pressure has diminished somewhat, the RSI still remains in the neutral zone.
The rapid surge from oversold levels suggests a recent recovery phase, but the stabilization around 51 hints at a market pause as traders assess the next direction for PENGU price.
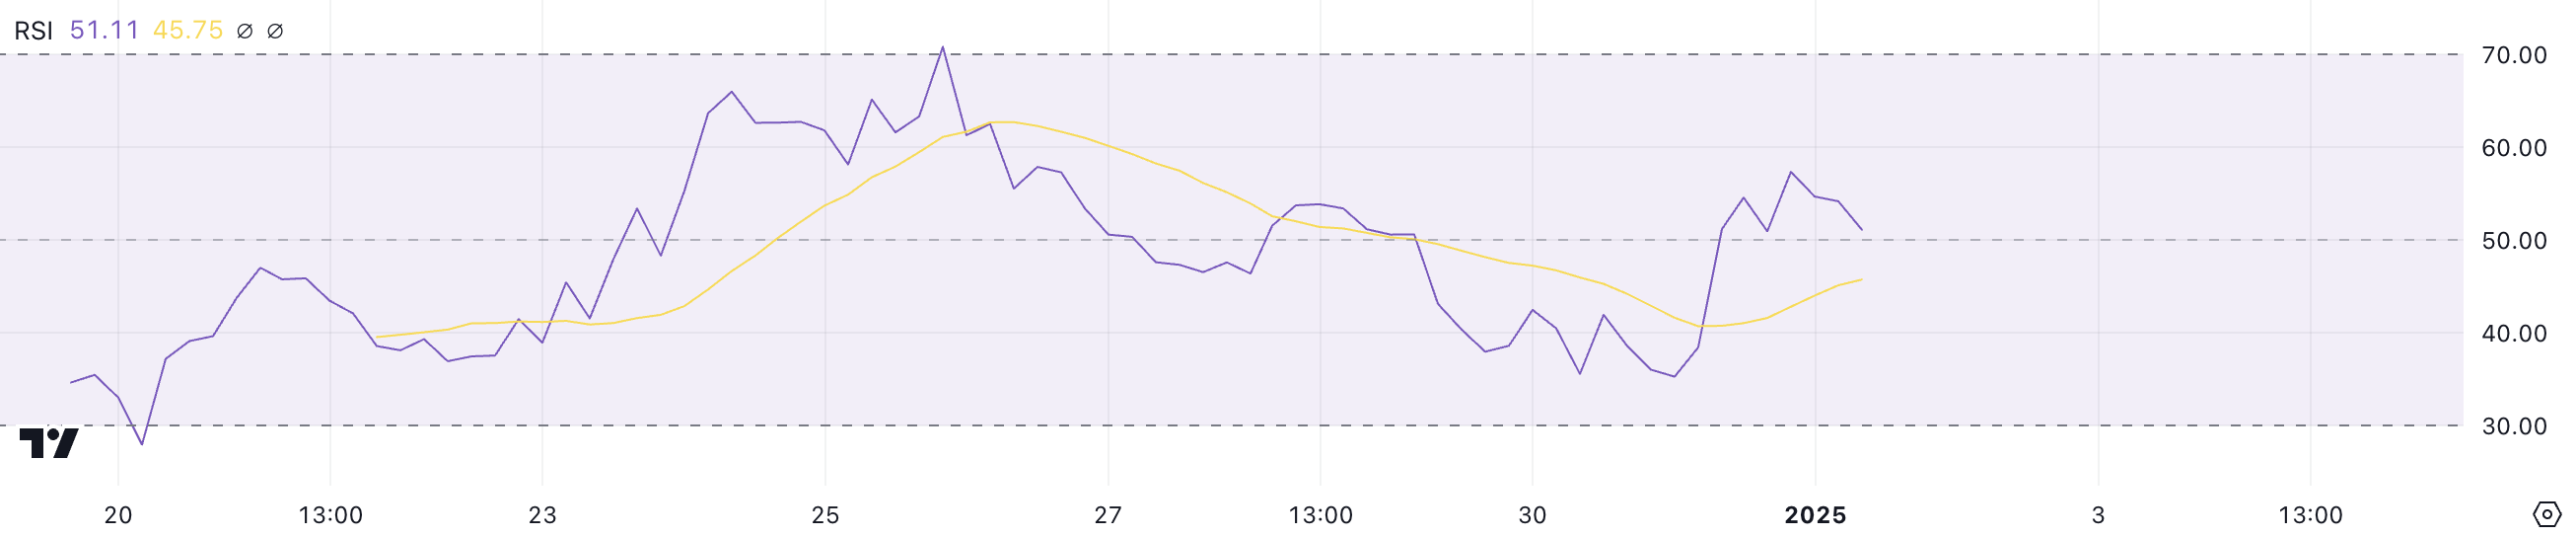 PENGU RSI. Source: TradingView.
The RSI is a momentum indicator that measures the strength and speed of price movements on a scale from 0 to 100. Readings above 70 indicate overbought conditions, often signaling a potential pullback, while readings below 30 suggest oversold conditions and a possible price recovery.
With PENGU’s RSI at 51, the indicator signals neither strong bullish nor bearish momentum, reflecting market indecision. In the short term, this neutral RSI suggests that PENGU price may consolidate unless a shift in buying or selling pressure pushes momentum in a clear direction.
PENGU Trend Lacks Strength
PENGU’s DMI chart shows its ADX currently at 20.3, slightly below the 25 level recorded a day ago, indicating a weakening trend strength. This decline in ADX suggests that while there was recent momentum, the market is now entering a phase of reduced directional force.
With the +DI (Directional Indicator) at 20.7 and the -DI at 16.1, the chart reflects a bullish bias. Buying pressure remains stronger than selling pressure, albeit with modest intensity.
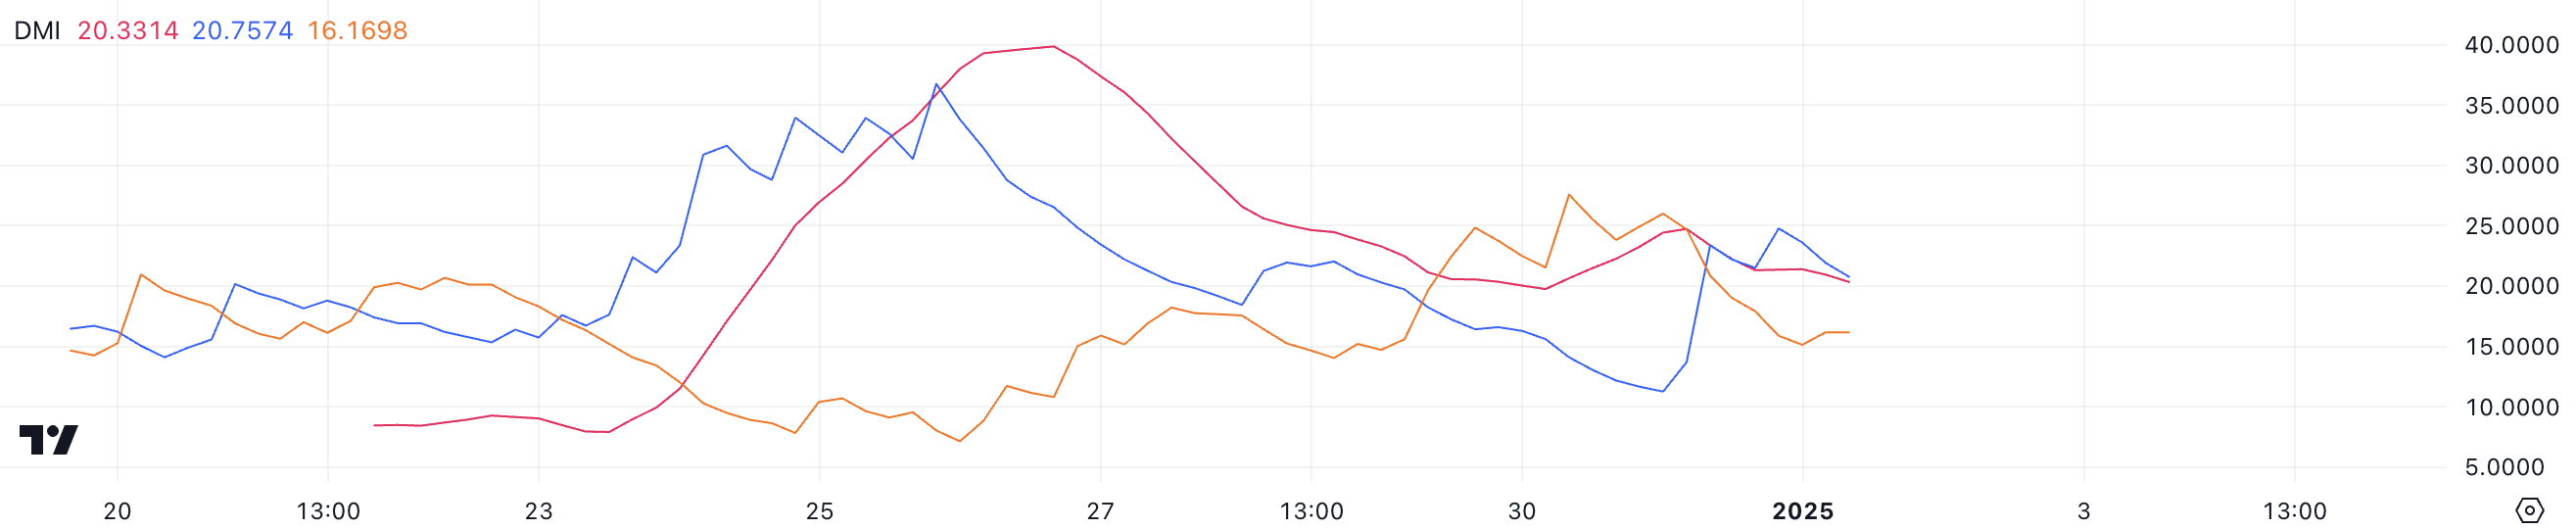 PENGU DMI. Source: TradingView.
The Average Directional Index (ADX) measures the strength of a trend on a scale from 0 to 100, regardless of its direction. Values above 25 indicate a strong trend, while readings below 20, like PENGU current 20.3, signal a weak or absent trend. The slightly higher +DI compared to the -DI suggests that the bullish momentum persists, but the declining ADX points to a lack of significant strength behind the movement.
In the short term, PENGU’s price may experience limited volatility unless the ADX rises again to confirm a stronger trend or the directional indicators show a decisive shift in buying or selling pressure.
PENGU Price Prediction: Will It Reach $0.05 in January?
PENGU price has climbed over 9% in the last 24 hours, pushing its market cap to $2 billion, making it one of the biggest Solana meme coins, as strong momentum drives bullish sentiment. If this uptrend continues to strengthen, PENGU price is likely to test the $0.043 resistance level soon.
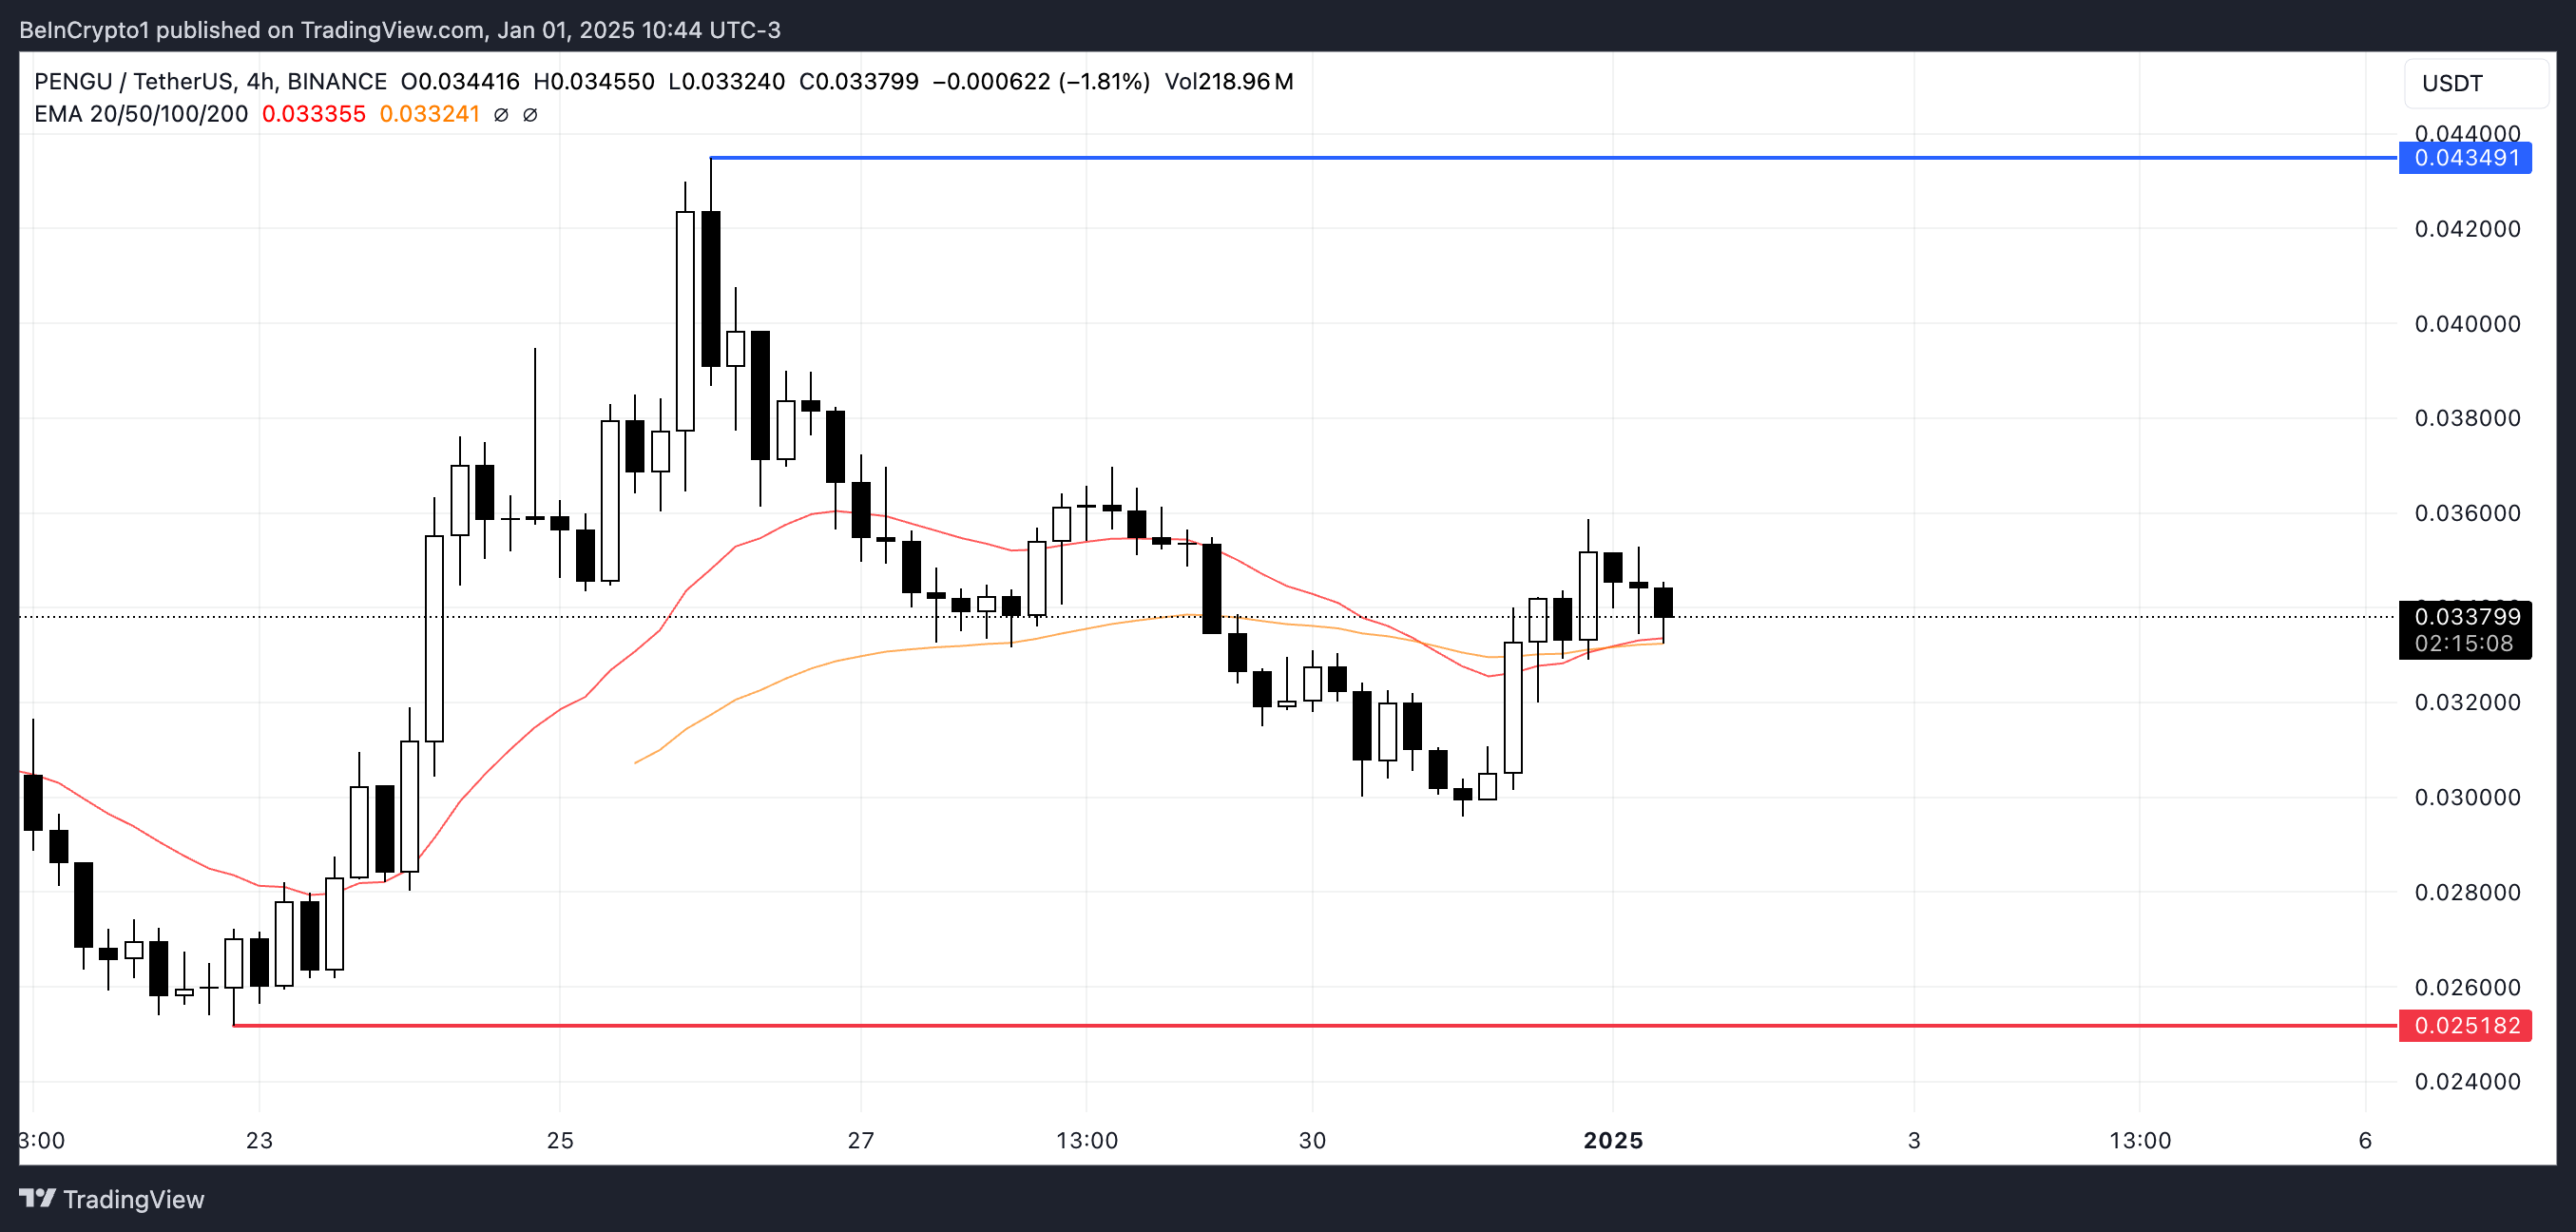 PENGU Price Analysis. Source: TradingView.
Breaking past this level could open the door for further gains. With targets at $0.045 and $0.05, PENGU could approach or even surpass its previous all-time highs, surpassing BONK’s market cap again.
However, if the trend reverses and bearish momentum takes hold, PENGU price could face a sharp correction. Its closest strong support lies at $0.025, a critical level that must hold to prevent further declines.
Read more
* The content presented above, whether from a third party or not, is considered as general advice only. This article should not be construed as containing investment advice, investment recommendations, an offer of or solicitation for any transactions in financial instruments.


