

Ethereum (ETH) Price Rally to $2,600 Comes with Unsettling Risks

- WTI Oil pulls back as Hormuz supply worries ease, Iran-US tensions keep volatility high
- Gold slumps below $4,700 on Trump rejection of Iran peace proposal
- WTI falls to near $93.50 after Israel, Iran signal an end to hostilities
- Australian Dollar holds losses ahead of RBA policy decision
- When Will the Gold Dilemma Be Resolved? Breakdown of US-Iran Negotiations Puts Gold Prices Under Pressure Again, Can It Return to $5,000?
- Ignoring Strategy Reduction Warning, Bitcoin Nears $82,000, Hitting Highest Price Since February

Ethereum’s (ETH) price has surpassed $2,500 for the first time since October 1. However, despite the market’s rising optimism, this upward movement may not be as smooth as it seems.
In this analysis, BeInCrypto highlights several on-chain metrics that suggest a significant portion of ETH’s gains could be stifled.
Ethereum Is Not Yet Free from Problems
Ethereum’s price increase represents a 6% hike in the last 30 days. Within the last 24 hours, the cryptocurrency’s volume has increased by 90%, indicating rising investor interest in Ethereum.
Despite this, data from IntoTheBlock shows that Ethereum’s Coins Holding Time has decreased by 56% in the last seven days. Coins Holding Time shows the amount of time investors have held a cryptocurrency without selling it.
Typically, longer holding times correlate with higher chances of price increases, while shorter holding times often signal potential price drops. In Ethereum’s case, the recent decline in holding time suggests that, despite the recent price rise, ETH holders are still selling.
Read more: How To Buy Ethereum (ETH) With a Credit Card: Complete Guide
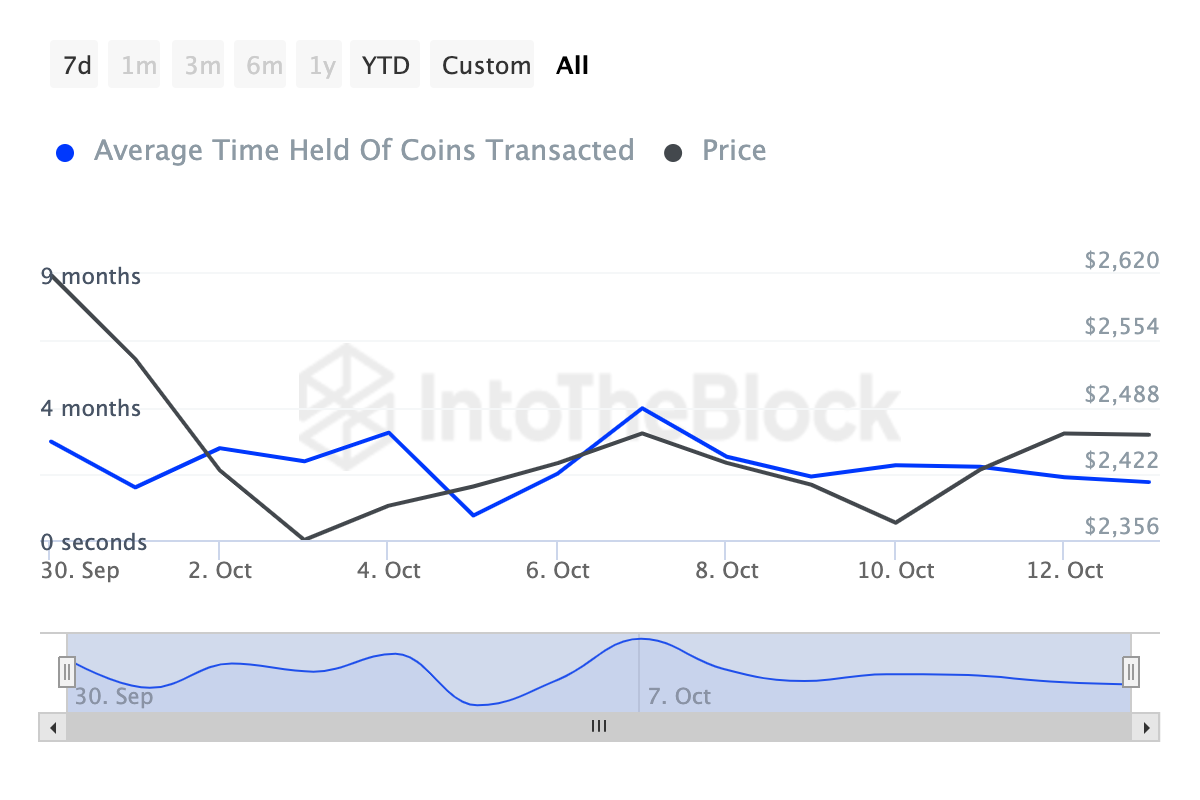 Ethereum Coins Holding Time. Source: IntoTheBlock
If sustained, the cryptocurrency’s value might drop in the short term. The Network Value to Transaction (NVT) ratio is another metric supporting a drawdown. A high NVT ratio suggests that market capitalization is higher than the value transacted on the network.
A low NVT ratio, on the other hand, indicates that transaction volume is outpacing the market cap growth. While the former is a bearish sign, the latter is a bullish one.
According to Glassnode, Ethereum’s NVT ratio has been rising for the last few days, suggesting that ETH’s price could be overvalued relative to the current market condition.
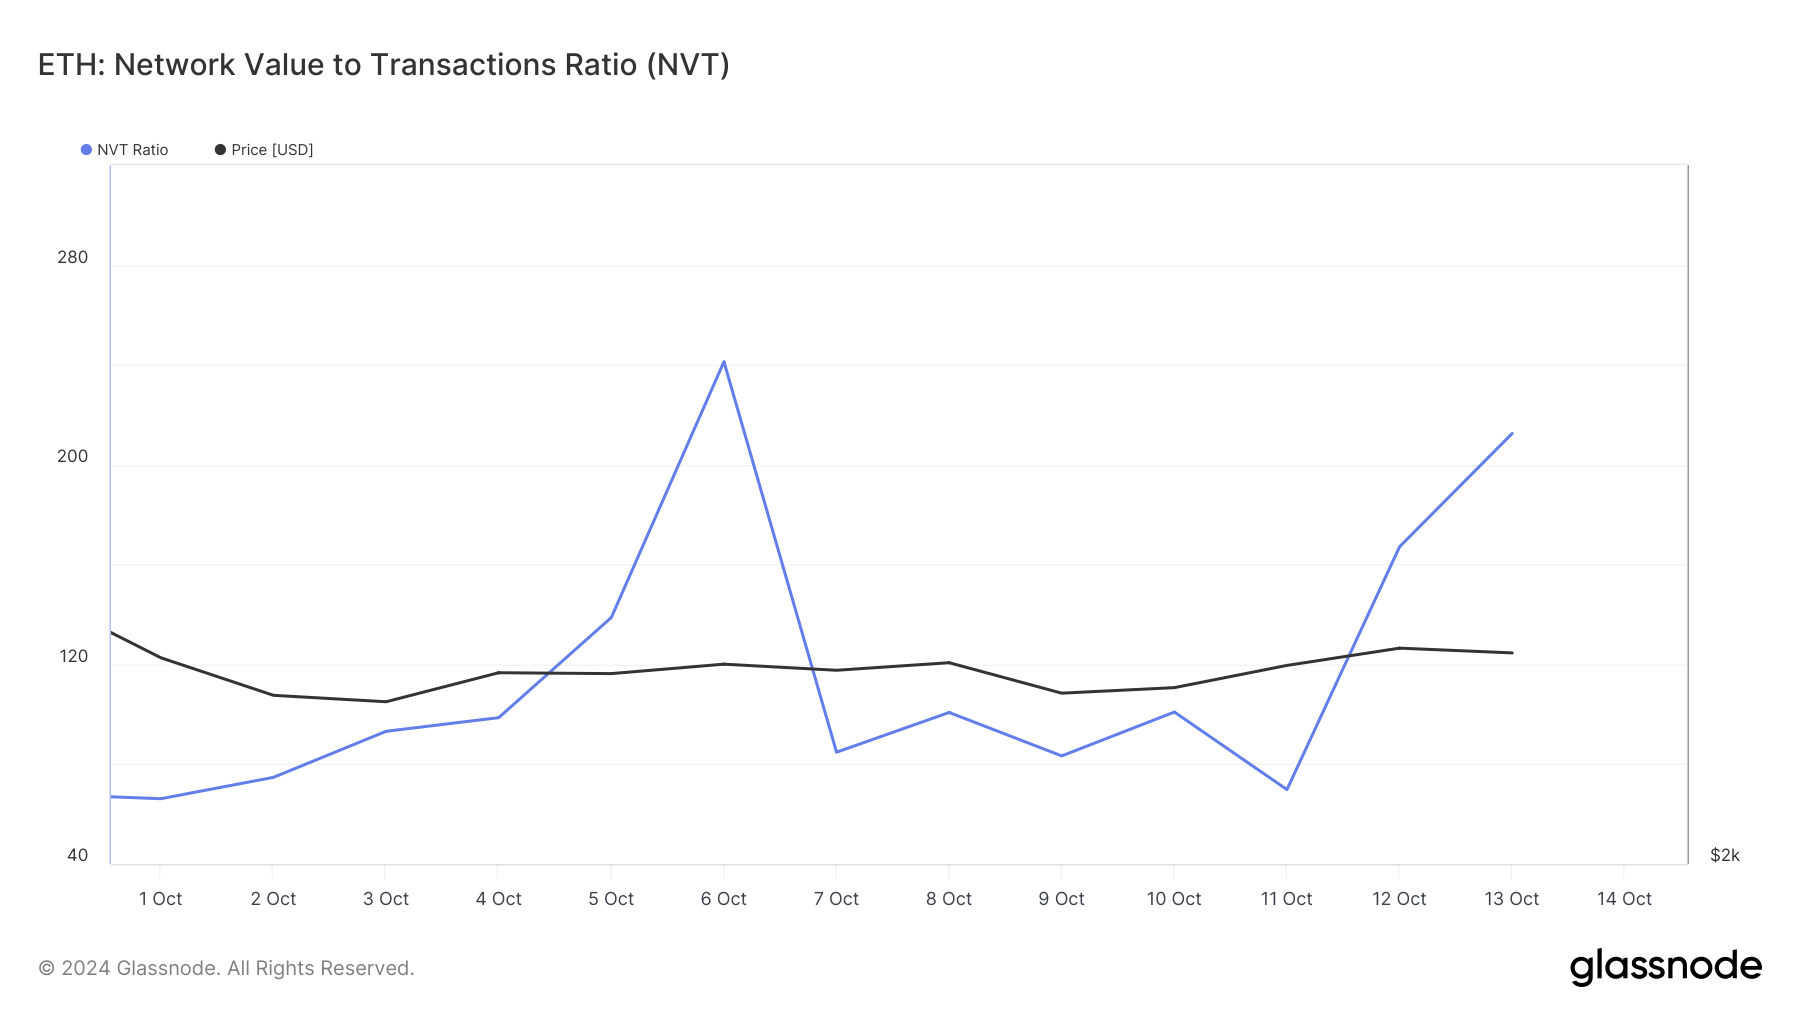 Ethereum NVT Ratio. Source: Glassnode
ETH Price Prediction: Likely Drop Below $2,400
A look at the ETH/USD daily chart shows that the Average True Range (ATR) has remained flat. Low readings of the ATR suggest low volatility and the possibility of a reversal or continued consolidation.
High ATR, on the other hand, suggests rising volatility and a potential for prices to keep moving upward. Since the indicator is flat, it appears that ETH’s price could drop to $2,345. But that would only be the case if buying pressure decreases and bears take control of the altcoin’s direction.
Read more: Ethereum (ETH) Price Prediction 2024/2025/2030
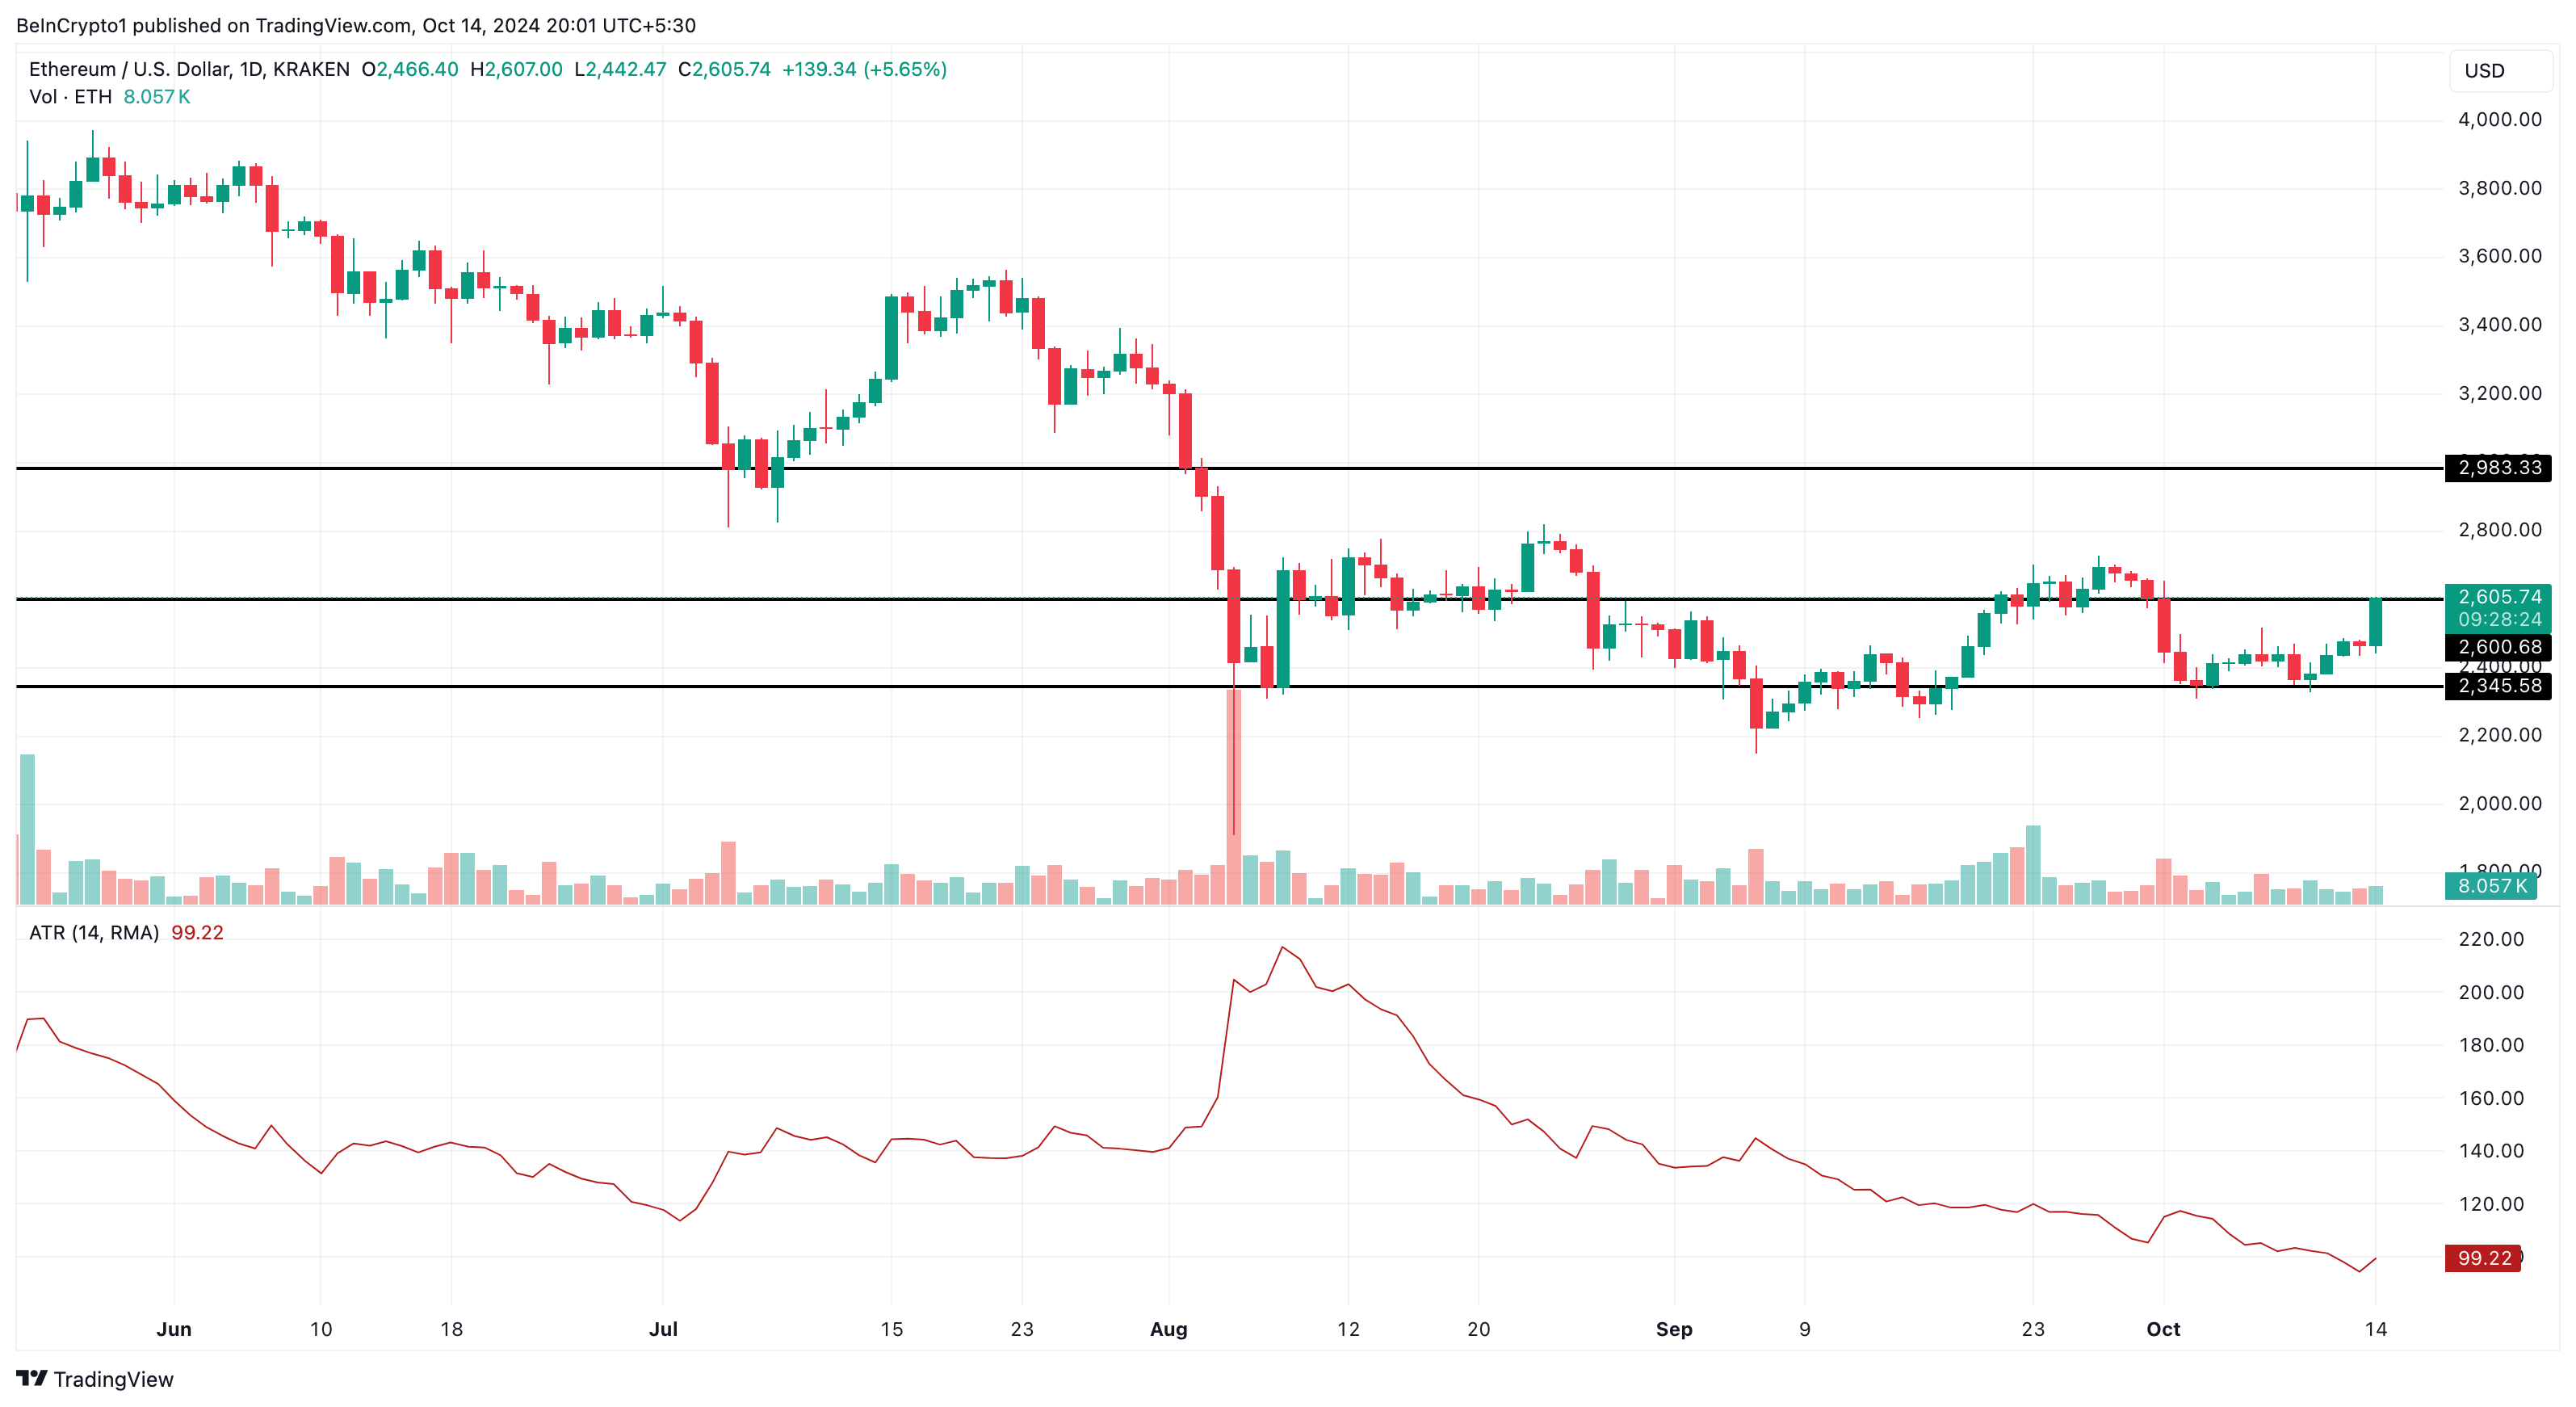 Ethereum Daily Price Analysis. Source: TradingView
Ethereum’s price might climb if bulls ensure that bears do not run the show. In that situation, the cryptocurrency’s value could rally much higher than $2,600, possibly hitting $2,983.
Read more
* The content presented above, whether from a third party or not, is considered as general advice only. This article should not be construed as containing investment advice, investment recommendations, an offer of or solicitation for any transactions in financial instruments.


