


Ethereum Struggles to Reclaim $3,000 as Exchange Supply Hits Six-Month Low

- Bitcoin Drops to $70,000. U.S. Government Refuses to Bail Out Market, End of Bull Market or Golden Pit?
- Gold rallies further beyond $5,050 amid flight to safety, dovish Fed expectations
- Bitcoin Bottom Debate: $70,000 or $50,000?
- A Crash After a Surge: Why Silver Lost 40% in a Week?
- Bitcoin Slips Below 75,000 Mark. Will Strategy Change Its Mind and Sell?
- Bitcoin Rout. Bridgewater Founder Dalio Publicly Backs Gold.

Ethereum (ETH) price has struggled to regain momentum after losing the $3,000 threshold on February 2, remaining below that level ever since. Over the past 30 days, ETH has dropped more than 20%, reflecting ongoing market weakness and uncertainty about its next move.
Technical indicators like the DMI suggest a lack of a clear trend, with both bullish and bearish pressures weakening in recent days.
Meanwhile, the supply of ETH on exchanges has fallen to its lowest level in six months, which could signal accumulation and reduced selling pressure, potentially setting the stage for a recovery attempt.
Ethereum DMI Shows the Lack of a Clear Trend
Ethereum’s DMI chart reveals a weakening trend, as the ADX has declined to 27.5 from 33.8 in the past day. The ADX, or Average Directional Index, is a key indicator used to measure trend strength. Readings above 25 typically signal a strong trend, while values below 20 indicate a weak or nonexistent trend.
The downward movement of the ADX suggests that Ethereum recent trend is losing momentum rather than gaining strength, which could indicate market indecision.
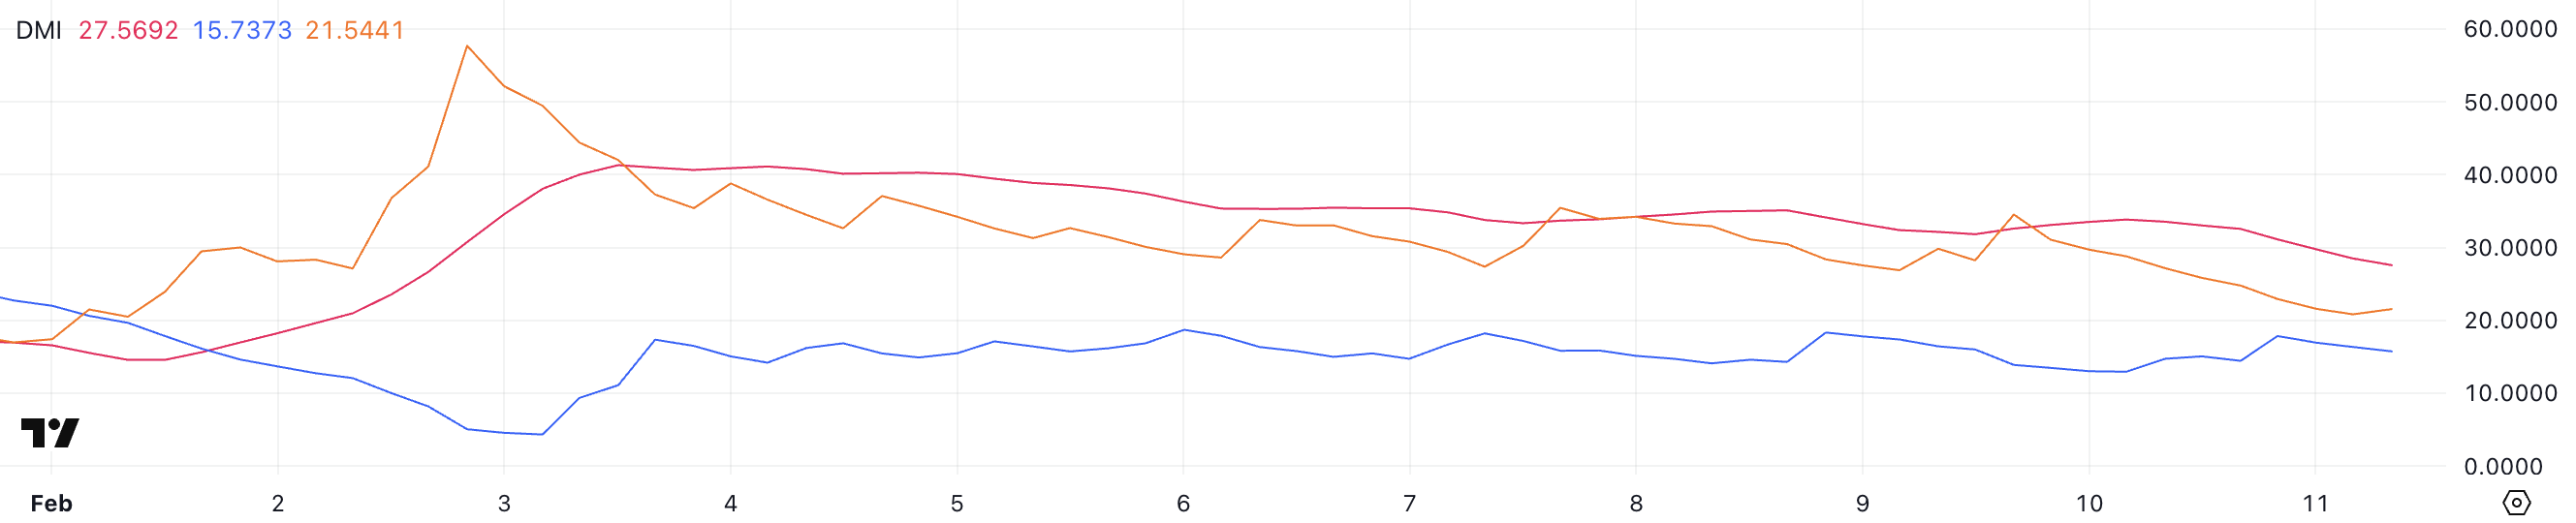
ETH DMI. Source: TradingView.
Looking at the directional indicators, +DI has dropped from 17.8 to 15.7, while -DI has also declined from 22.9 to 21.5. This suggests that both buying and selling pressure have weakened, leaving Ethereum without a clear directional bias.
With -DI still above +DI, bears maintain a slight edge, but the declining ADX indicates the trend is not gaining traction.
This setup points to a phase of consolidation or potential trend reversal rather than a continuation of strong bearish momentum. Until there is a clear divergence in the directional indicators or a rise in ADX, Ethereum’s next move remains uncertain.
ETH Supply on Exchanges Reached Its Lowest Level In Six Months
The supply of ETH on exchanges saw a notable shift over the past few weeks. After increasing from 10.35 million on January 19 to 10.73 million on February 1, exchange balances have since declined sharply, falling consecutively to 9.63 million – the lowest level in six months, dating back to August 2024.
This steady decrease in ETH held on exchanges signals a significant shift in investor behavior, potentially impacting price action in the near term.
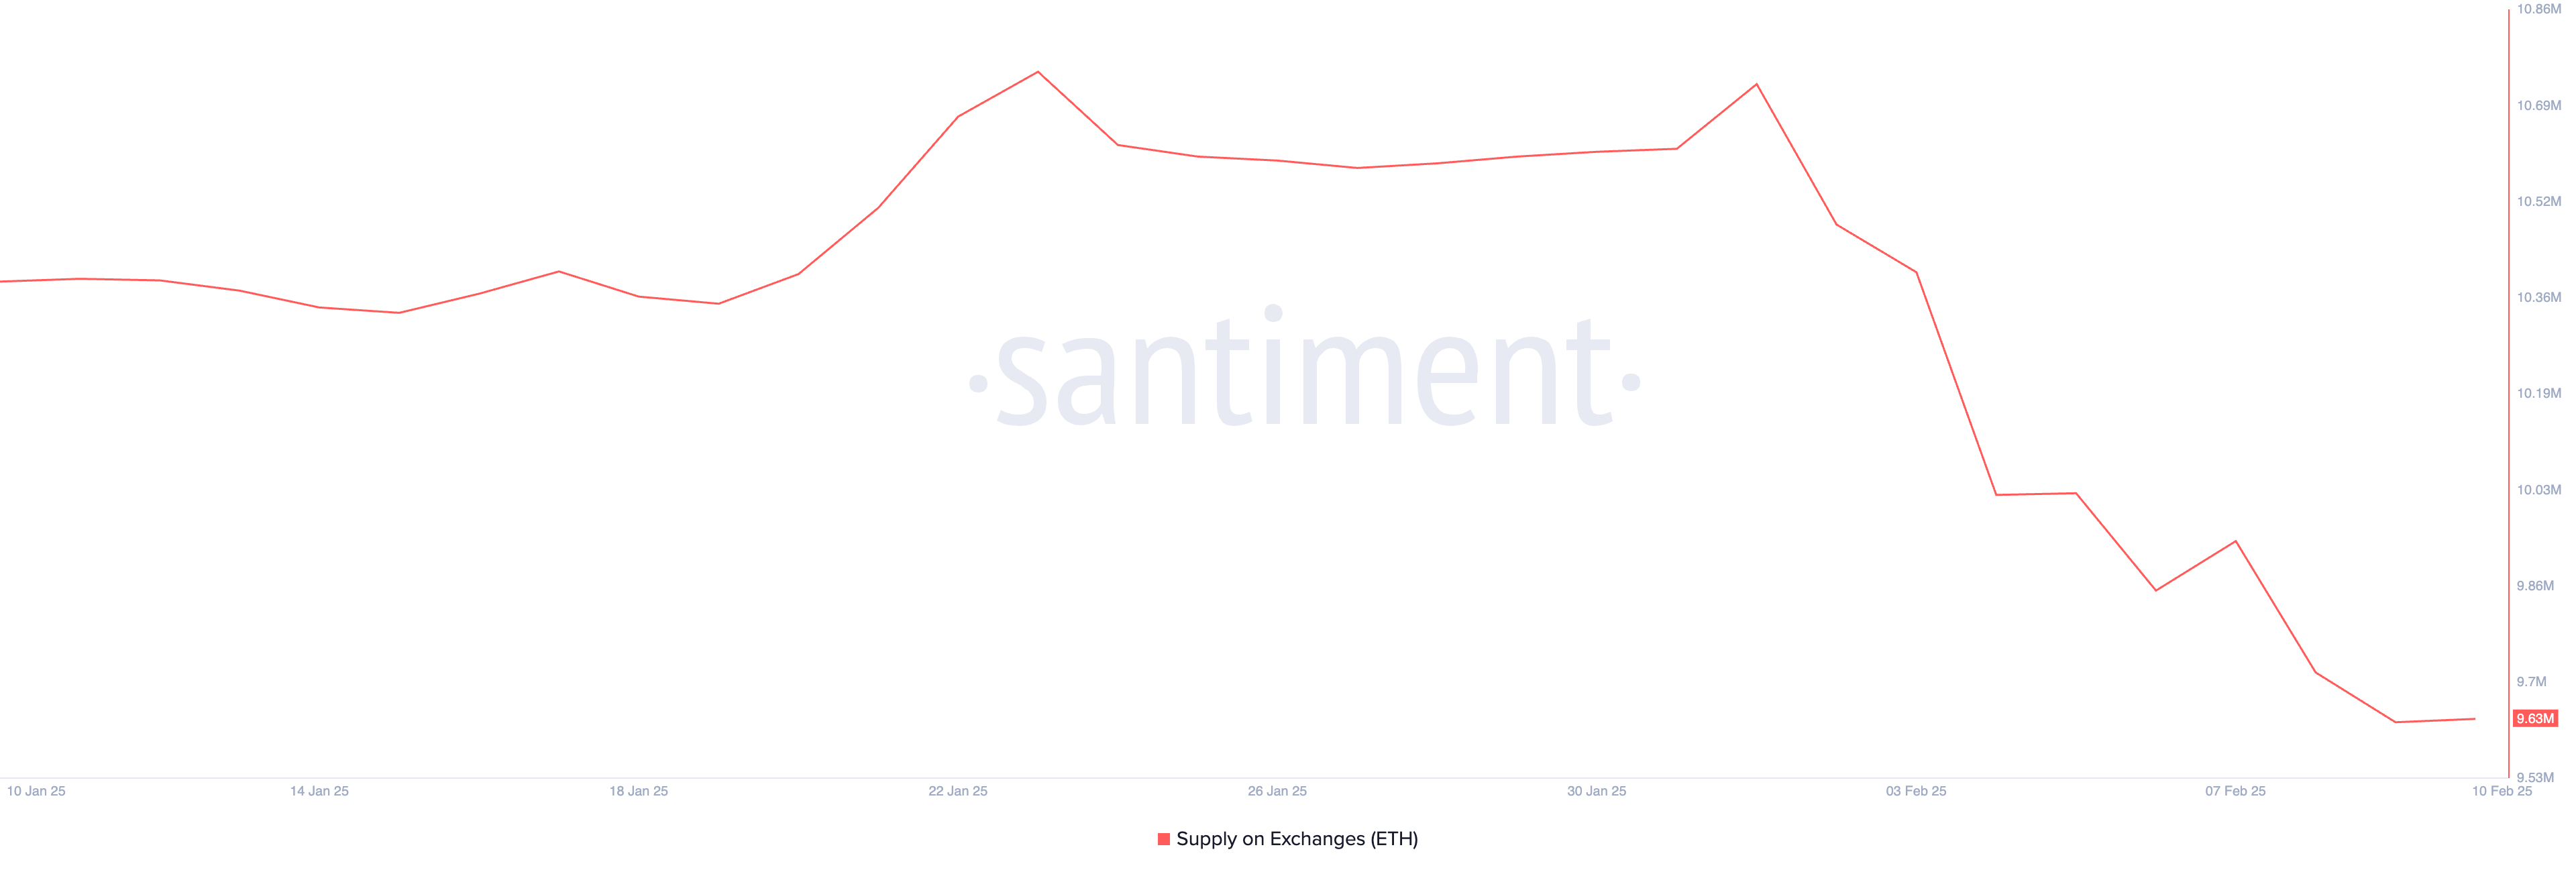 ETH Supply on Exchanges. Source: Santiment.
The supply of ETH on exchanges is a key metric in understanding market sentiment. When exchange balances rise, it often suggests that investors are preparing to sell, as more ETH is readily available for trading. This can create selling pressure, leading to bearish conditions.
Conversely, when Ethereum supply on exchanges declines, it implies that investors are moving their holdings to private wallets, reducing the immediate sell-side liquidity.
This trend is generally considered bullish, as it suggests confidence in holding rather than selling. With ETH exchange supply now at its lowest level in six months, it could indicate strong accumulation, reducing selling pressure and potentially setting the stage for upward price momentum.
ETH Price Prediction: Can Ethereum Rise Back to $3,000?
Ethereum price chart shows that its EMA lines still indicate a bearish structure, with short-term moving averages positioned below long-term ones.
This suggests that ETH price has not yet established a confirmed uptrend. However, if buying momentum strengthens and ETH can recover a sustained upward movement, it may first challenge the resistance at $2,798.
A successful breakout above this level could open the door for further gains toward $3,024. If bullish momentum persists, ETH could eventually target the next major resistance at $3,442, signaling a full trend reversal to the upside.
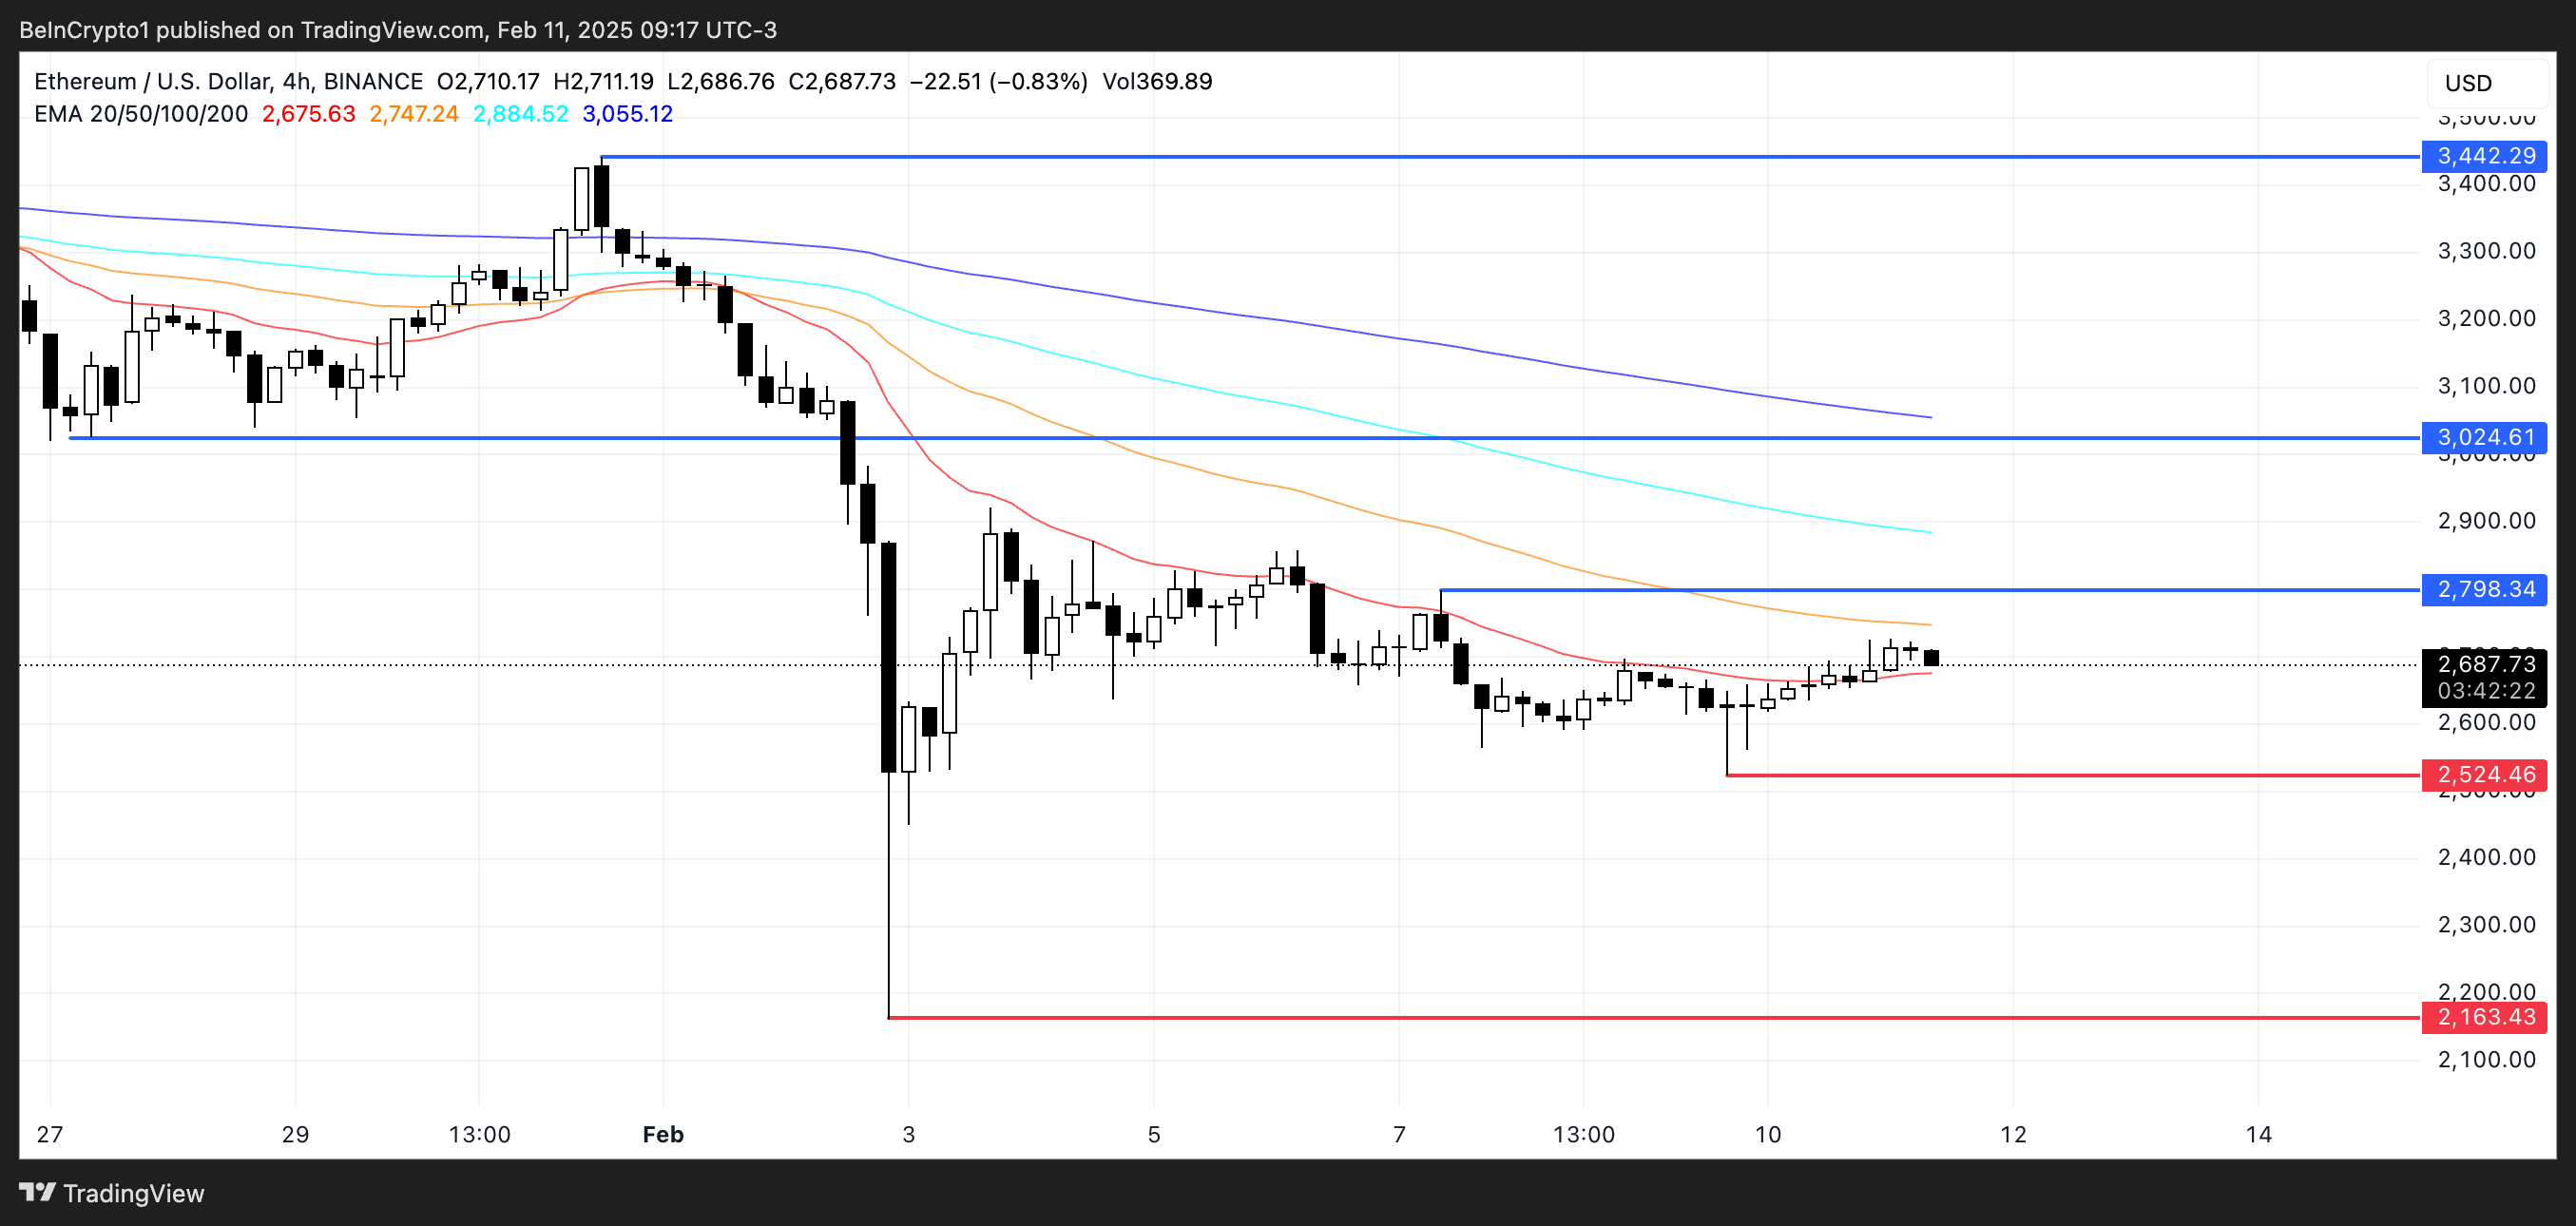
ETH Price Analysis. Source: TradingView.
On the other hand, failure to establish an uptrend could leave ETH price vulnerable to a retest of its key support at $2,524.
A breakdown below this level, especially with increasing selling pressure, would confirm a bearish continuation, potentially driving ETH further down to $2,163.
Read more
* The content presented above, whether from a third party or not, is considered as general advice only. This article should not be construed as containing investment advice, investment recommendations, an offer of or solicitation for any transactions in financial instruments.


