


Meme coins DOGE, SHIB and PEPE recover as Iran-Israel ceasefire holds

- Bitcoin Drops to $70,000. U.S. Government Refuses to Bail Out Market, End of Bull Market or Golden Pit?
- Gold rallies further beyond $5,050 amid flight to safety, dovish Fed expectations
- Bitcoin Bottom Debate: $70,000 or $50,000?
- A Crash After a Surge: Why Silver Lost 40% in a Week?
- Bitcoin Slips Below 75,000 Mark. Will Strategy Change Its Mind and Sell?
- Bitcoin Rout. Bridgewater Founder Dalio Publicly Backs Gold.
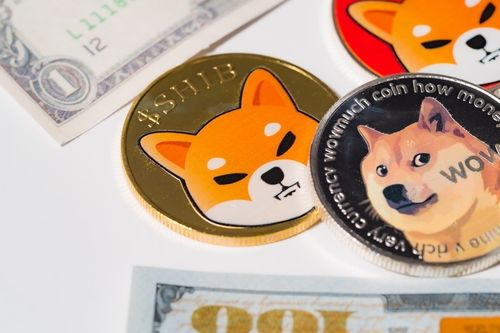
Dogecoin, Shiba Inu, and Pepe meme coins extend their gains on Tuesday after recovering more than 8%, 9% and 11%, respectively, on Monday.
Derivatives data for DOGE, SHIB, and PEPE show a bullish bias as funding rates turn positive.
The technical outlook for the three main meme coins suggests a V-shaped recovery targeting double-digit gains ahead.
Meme coins Dogecoin (DOGE), Shiba Inu (SHIB) and Pepe (PEPE) are extending their gains on Tuesday after a sharp recovery the previous day. The announcement of a ceasefire between Iran and Israel on Monday fueled this recovery. Derivatives data also shows the funding rates of DOGE, SHIB, and PEPE turn positive as bullish bets rise.
Risk-on sentiment fuels meme coin recovery
Donald Trump announced late on Monday that a “complete and total” ceasefire between Israel and Iran, pausing the ongoing 12-day war. The announcement led to a sharp recovery in crypto markets, with top meme coins such as DOGE, SHIB, and PEPE rising by more than 8%, 9%, and 11%, respectively, that day. On Tuesday, these meme coins continued to extend their gains.

DOGE, SHIB and PEPE derivatives data show bullish bias
CoinGlass’s OI-Weighted Funding Rate data for DOGE, SHIB and PEPE shows that the number of traders betting that the price of these meme coins will slide further is lower than of those anticipating a price increase. Generally, a positive rate (longs pay shorts) indicates bullish sentiment, while negative numbers (shorts pay longs) indicate bearishness.
The metric for these top meme coins by market capitalization flipped to a positive rate on Tuesday, reading 0.0003% for DOGE, 0.0076% for SHIB, and 0.0044% for PEPE, suggesting a bullish outlook for the three meme coins.
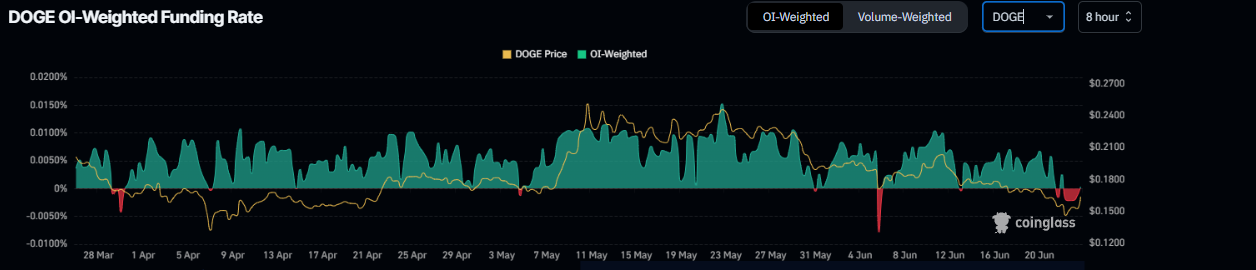
Dogecoin funding rate chart. Source: Coinglass
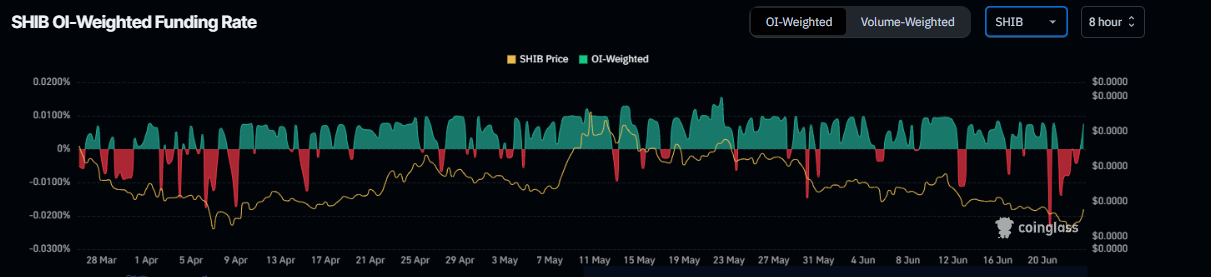
Shiba Inu funding rate chart. Source: Coinglass
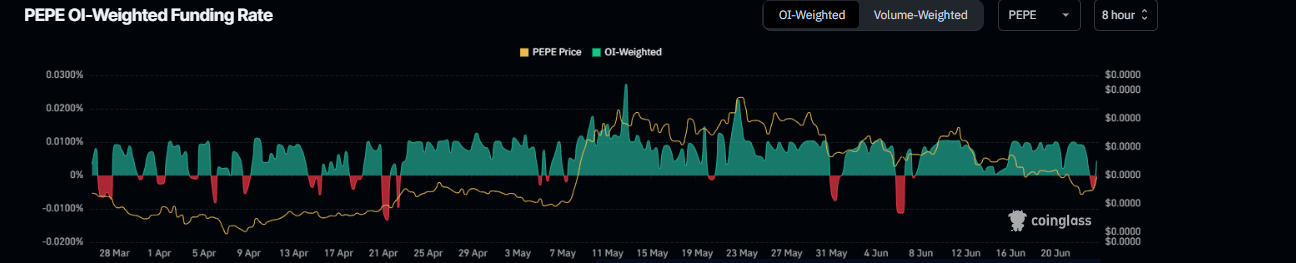
Pepe funding rate chart. Source: Coinglass
According to Coinglass’s data, the long-to-short ratio of SHIB and PEPE memecoins stands at 1.18 and 1.08, respectively, on Tuesday, marking the highest levels in over a month. However, for DOGE, the metric stands at 1.01, rising steadily since Saturday but still well below the high seen on June 5.
Generally, a ratio above one reflects bullish sentiment in the markets as more traders are betting on the meme coins' price to rise.
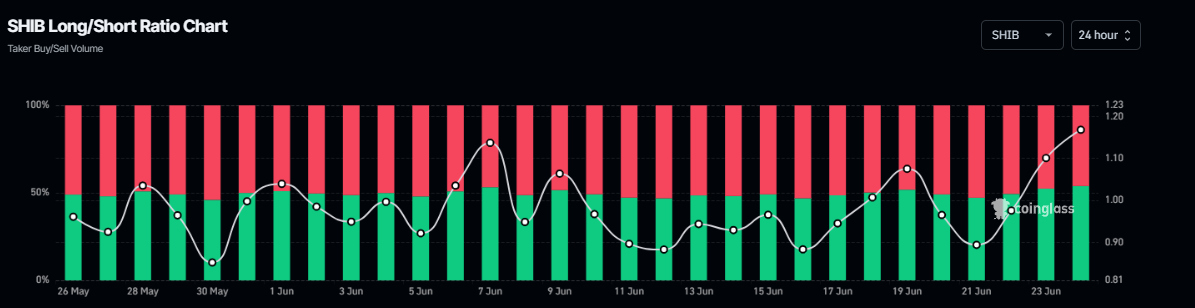
SHIB long-to-short ratio chart. Source: Coinglass
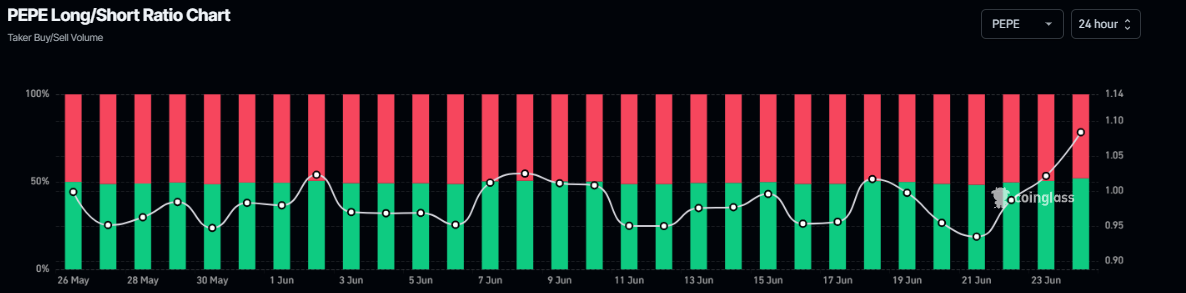
PEPE long-to-short ratio chart. Source: Coinglass

DOGE long-to-short ratio chart. Source: Coinglass
Technical outlook for DOGE, SHIB and PEPE shows V-shape recovery
Dogecoin price recovered sharply at the start of this week, rising by 9% on Monday. At the time of writing on Tuesday, it hovers at around $0.163.
If DOGE recovers and closes above the descending trendline (drawn by connecting multiple highs since the end of May), it could extend the rally toward its June 11 high of $0.206.
The Relative Strength Index (RSI) on the daily chart reads 38, recovering from the oversold levels seen on Sunday and suggesting a fading bearish momentum. The Moving Average Convergence Divergence (MACD) is hinting at a bullish crossover (the MACD line is close to cross above the signal line), which, if completed, would give a buy signal.
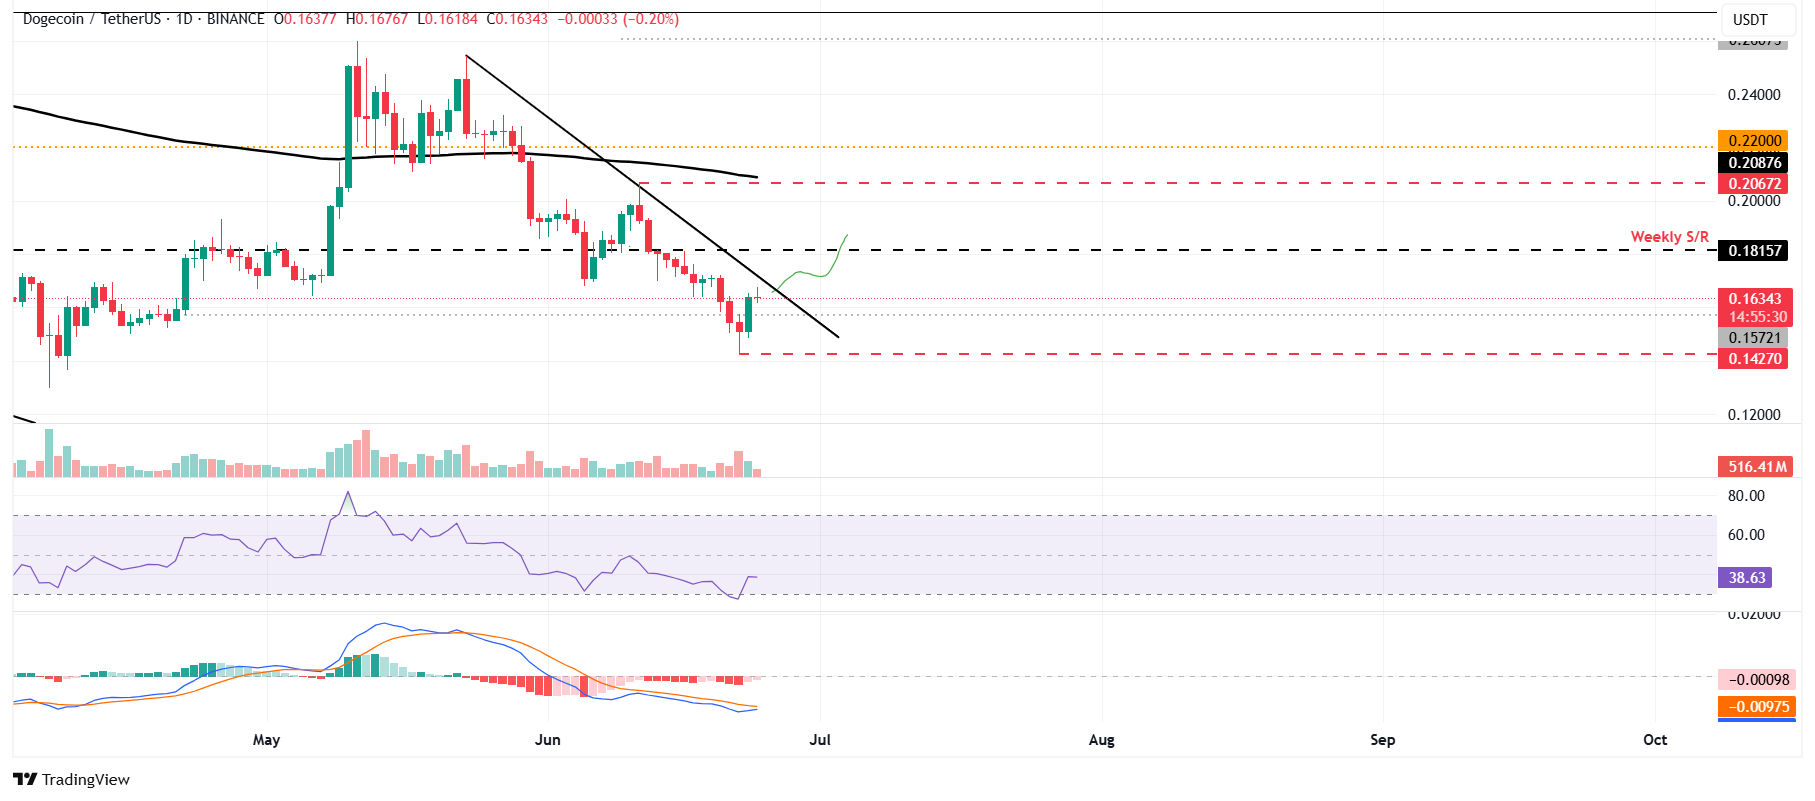
DOGE/USDT daily chart
Conversely, if DOGE fails to recover and corrects, it could extend the decline to retest its Sunday low of $0.142.
As for Shiba Inu, the daily chart shows that prices declined and retested the April 9 low at $0.000010 on Sunday and recovered by 9.15% the next day, closing above the daily resistance at $0.000011. At the time of writing on Tuesday, it continues to recover, approaching a descending trendline drawn by connecting multiple high levels since mid-May.
If SHIB breaks and closes above the descending trendline, the next resistance could be found at the June 11 high of $0.000013.
Similar to DOGE, the RSI on the daily chart of SHIB reads 43, indicating a V-shaped recovery after retesting its oversold conditions on Sunday. The MACD is also flipping a bullish crossover on the daily chart.
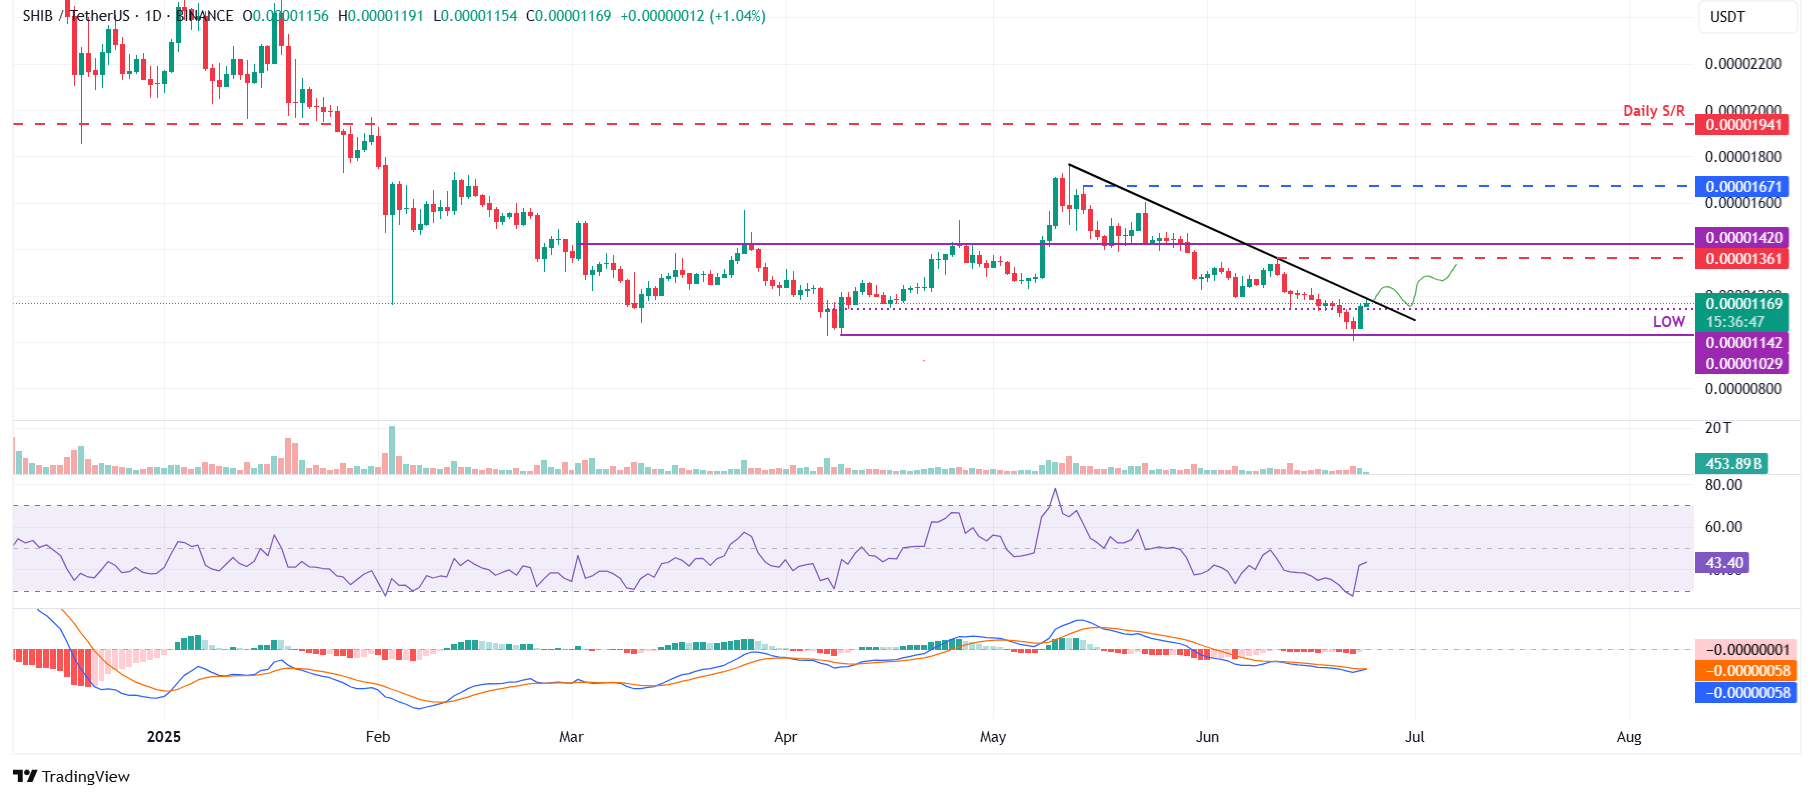
SHIB/USDT daily chart
If SHIB closes below the daily support at $0.000011 on a daily basis, it could extend the decline toward its April 9 low at $0.000010.
In Pepe's case, its price dipped below its daily support level at $0.0000088 on Sunday but recovered by more than 11% the following day. At the time of writing on Tuesday, it trades slightly higher at around $0.0000099.
If PEPE continues its recovery and closes above $0.000010 daily resistance, it could extend the rally toward its next daily resistance at $0.000012.
Like DOGE and SHIB, the RSI of PEPE recovers towards neutral levels, and the MACD is also hinting at a bullish crossover.
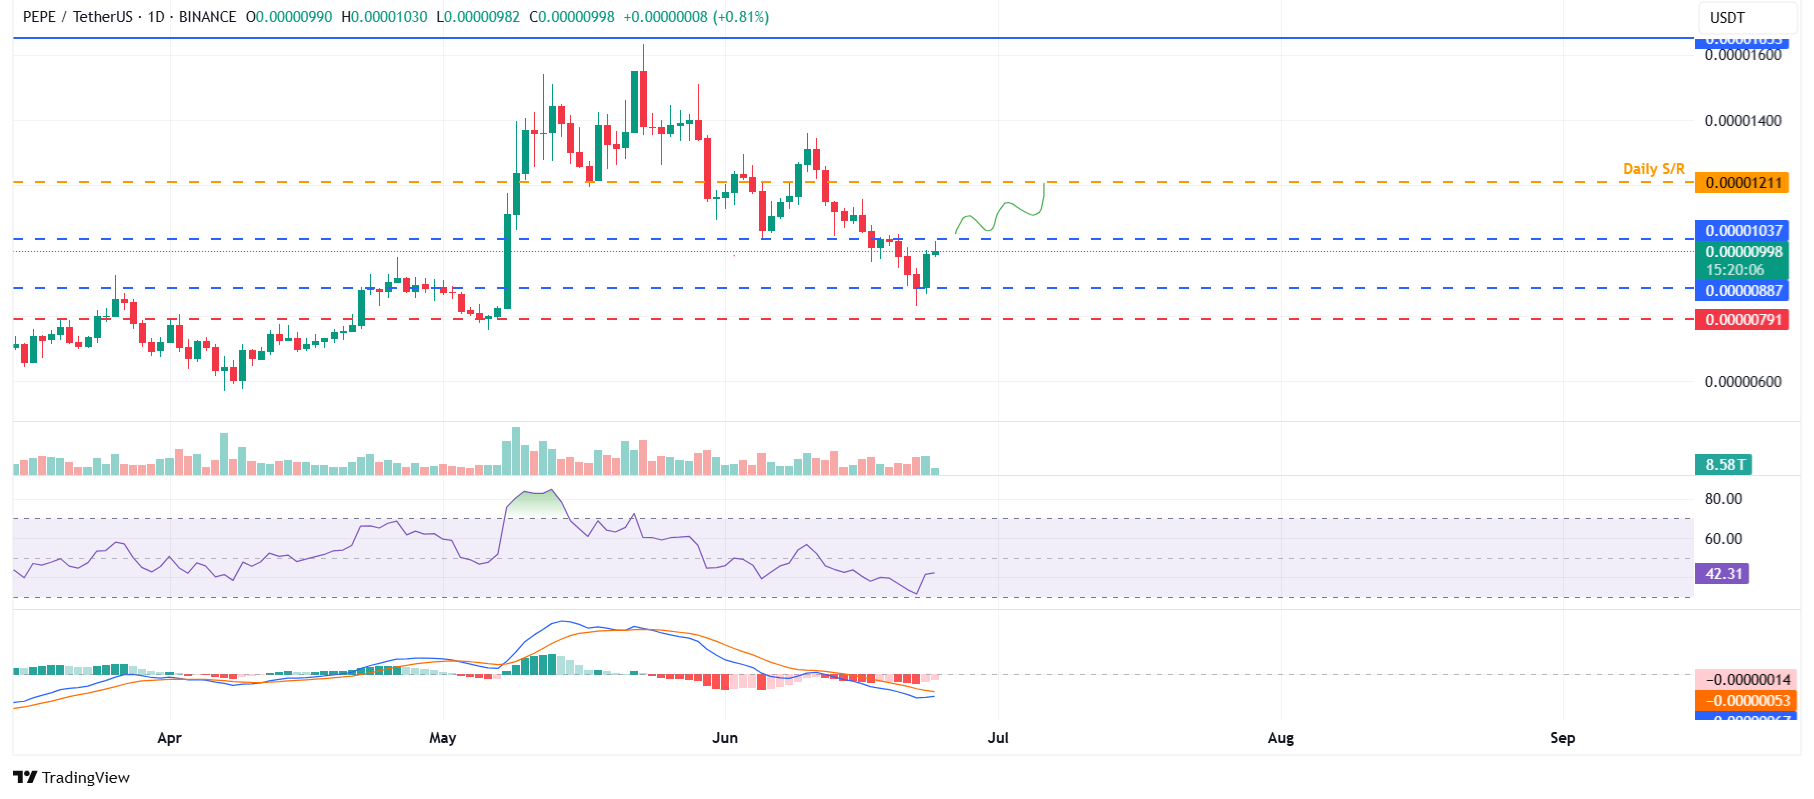
PEPE/USDT daily chart
If PEPE closes below the daily support at $0.0000088, it could extend the decline toward $0.0000079, the next daily support level.
Read more
* The content presented above, whether from a third party or not, is considered as general advice only. This article should not be construed as containing investment advice, investment recommendations, an offer of or solicitation for any transactions in financial instruments.


