

Dogecoin price jump above $0.20 triggers $13 million in liquidations

- Gold Price Forecast: Oil Price Breaking $100 Fuels Inflation Concerns, Will Gold Prices Fall Further?
- Gold Price Trend Forecast: Expectations of Easing US-Iran Tensions Boost Gold Prices, $4,070 Becomes Key Level for Bulls and Bears
- Gold rallies to over two-week high, eyes $4,150 as traders track US-Iran diplomacy efforts
- Euro declines to near 1.1400 as US launches fresh strikes on Iran
- Tesla Q2 Earnings Preview: Record Deliveries Fail to Hide Profit Pressure, Can Musk Rely on AI and Autonomous Driving to Unlock New Growth Space?
- WTI climbs above $87.00 as Middle East conflict threatens key choke points
Dogecoin price reclaims $0.20 after breaking out from an inverse head and shoulders bullish pattern.
DOGE's rally ignites a string of liquidations, comprising $1.6 million longs and $11.3 million shorts.
Open Interest surges 18% to $2.17 billion in 24 hours, signaling trader interest in the leading meme coin.
Dogecoin's near-overbought conditions could delay or hinder a breakout targeting $0.24.
Dogecoin (DOGE) price edges higher after stepping above $0.20 and climbing to trade around $0.21 at the time of writing on Friday. The leading meme coin's uptrend mirrors a broad-based bullish wave in the market, triggered by the trade agreement between the United States (US) and the United Kingdom (UK) on Thursday.
Dogecoin rally sparks massive liquidation wave
Dogecoin's price climbed in an engulfing bullish candle on Thursday, breaking the brief consolidation phase that followed the recovery from the tariff-triggered crash in early April. The meme coin flipped the 50-day Exponential Moving Average (EMA) around $0.18 into support, accelerating the uptrend above $0.20.
Meanwhile, the rally shook up market dynamics, especially for futures and options traders, with liquidations reaching approximately $13 million over the past 24 hours. Short liquidations dominated at $11.3 billion compared to $1.6 million for longs. This heavy skew toward short liquidations signals a short squeeze, where an increase in price forces short sellers to close positions, thus fueling the rally.
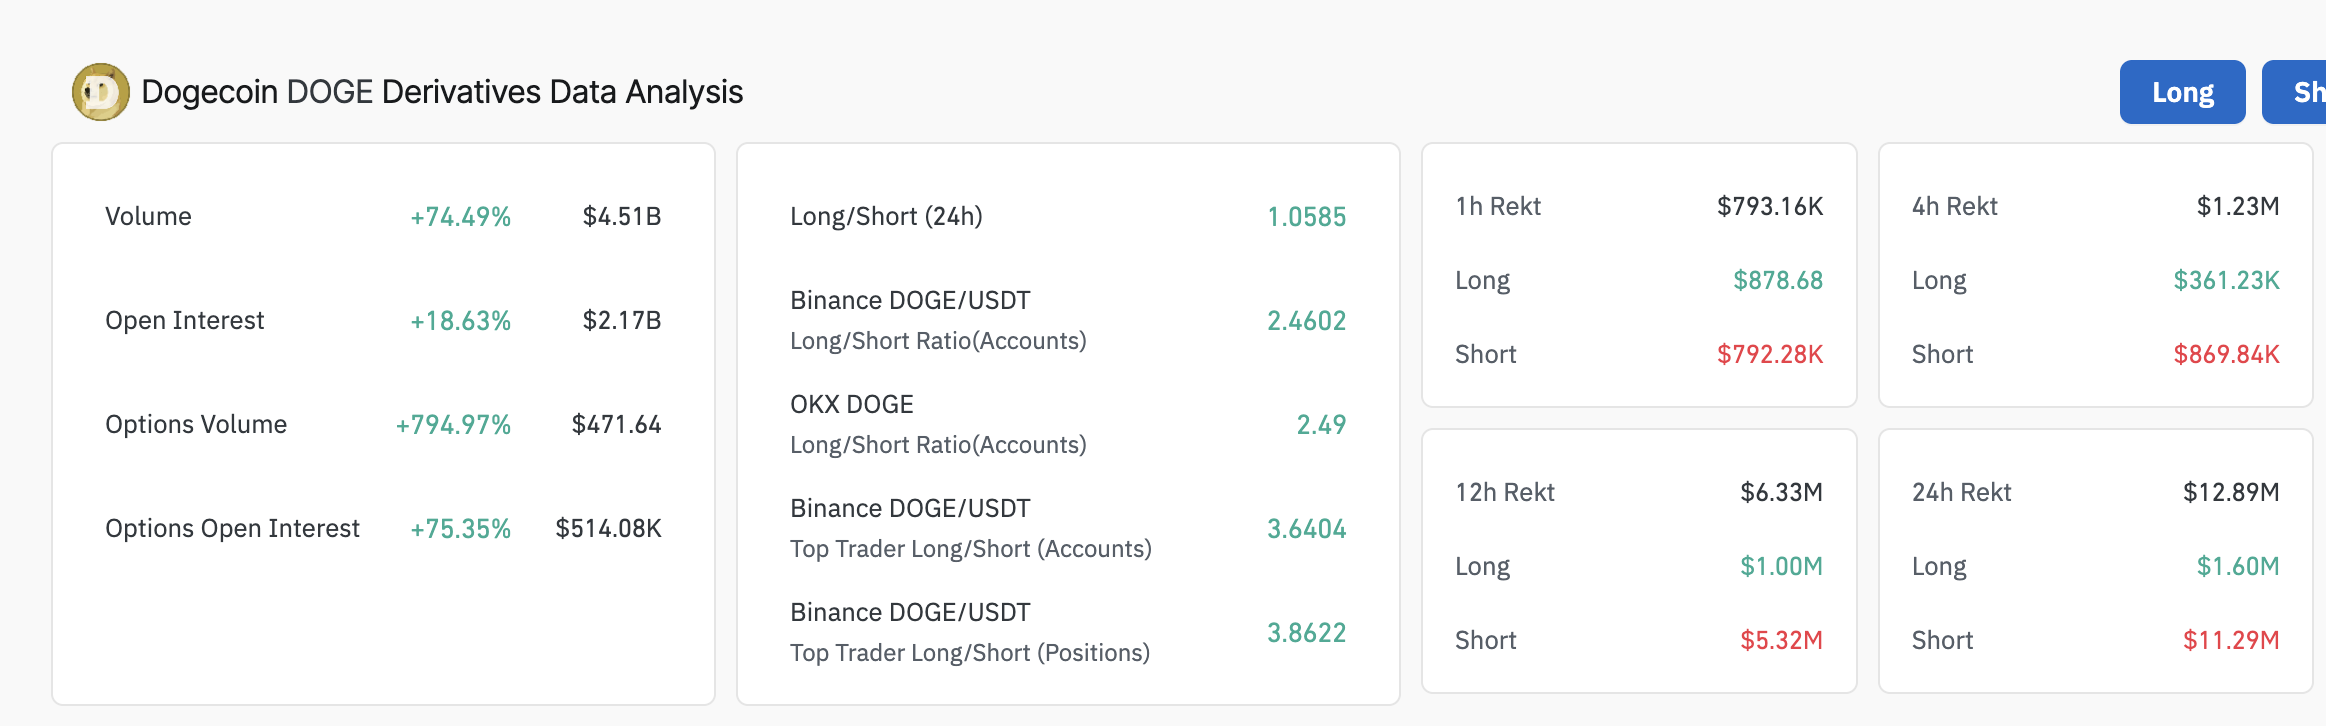
Dogecoin derivatives market data | Source: CoinGlass
The 18% Open Interest (OI) surge to $2.17 billion hints at increasing trader interest in the largest meme coin by market capitalization. In other words, the uptrend in DOGE's price encourages investors to seek exposure, betting on a longer rally.
Additionally, the long-to-short ratio of 2.4602 on Binance shows that long positions primarily drive the OI increase, as traders allocate more capital to bullish bets.
A 74.49% surge in the trading volume to $4.5 billion amplifies the OI and supports the heightened market activity. High volume during an uptrend, like in DOGE, often confirms a strong bullish momentum.
How far can Dogecoin's rally go?
Dogecoin's price displays a strong bullish structure after breaking out and confirming an inverse head and shoulders pattern in the daily chart below. The breakout on Thursday projected an approximately 33% surge to $0.24. The target is determined by measuring the height of the pattern from the neckline to the head and extrapolating above the breakout point.
With DOGE seeking support above the 100-day EMA at $0.20, there's a high probability that the uptrend will continue to tag the inverse head and shoulders patterns' target at $0.24 in upcoming sessions.
The Moving Average Convergence Divergence (MACD) indicator reinforces the bullish structure above the centre line. As the green histograms grow, they indicate a stronger tailwind, pointing to a continued price rise.
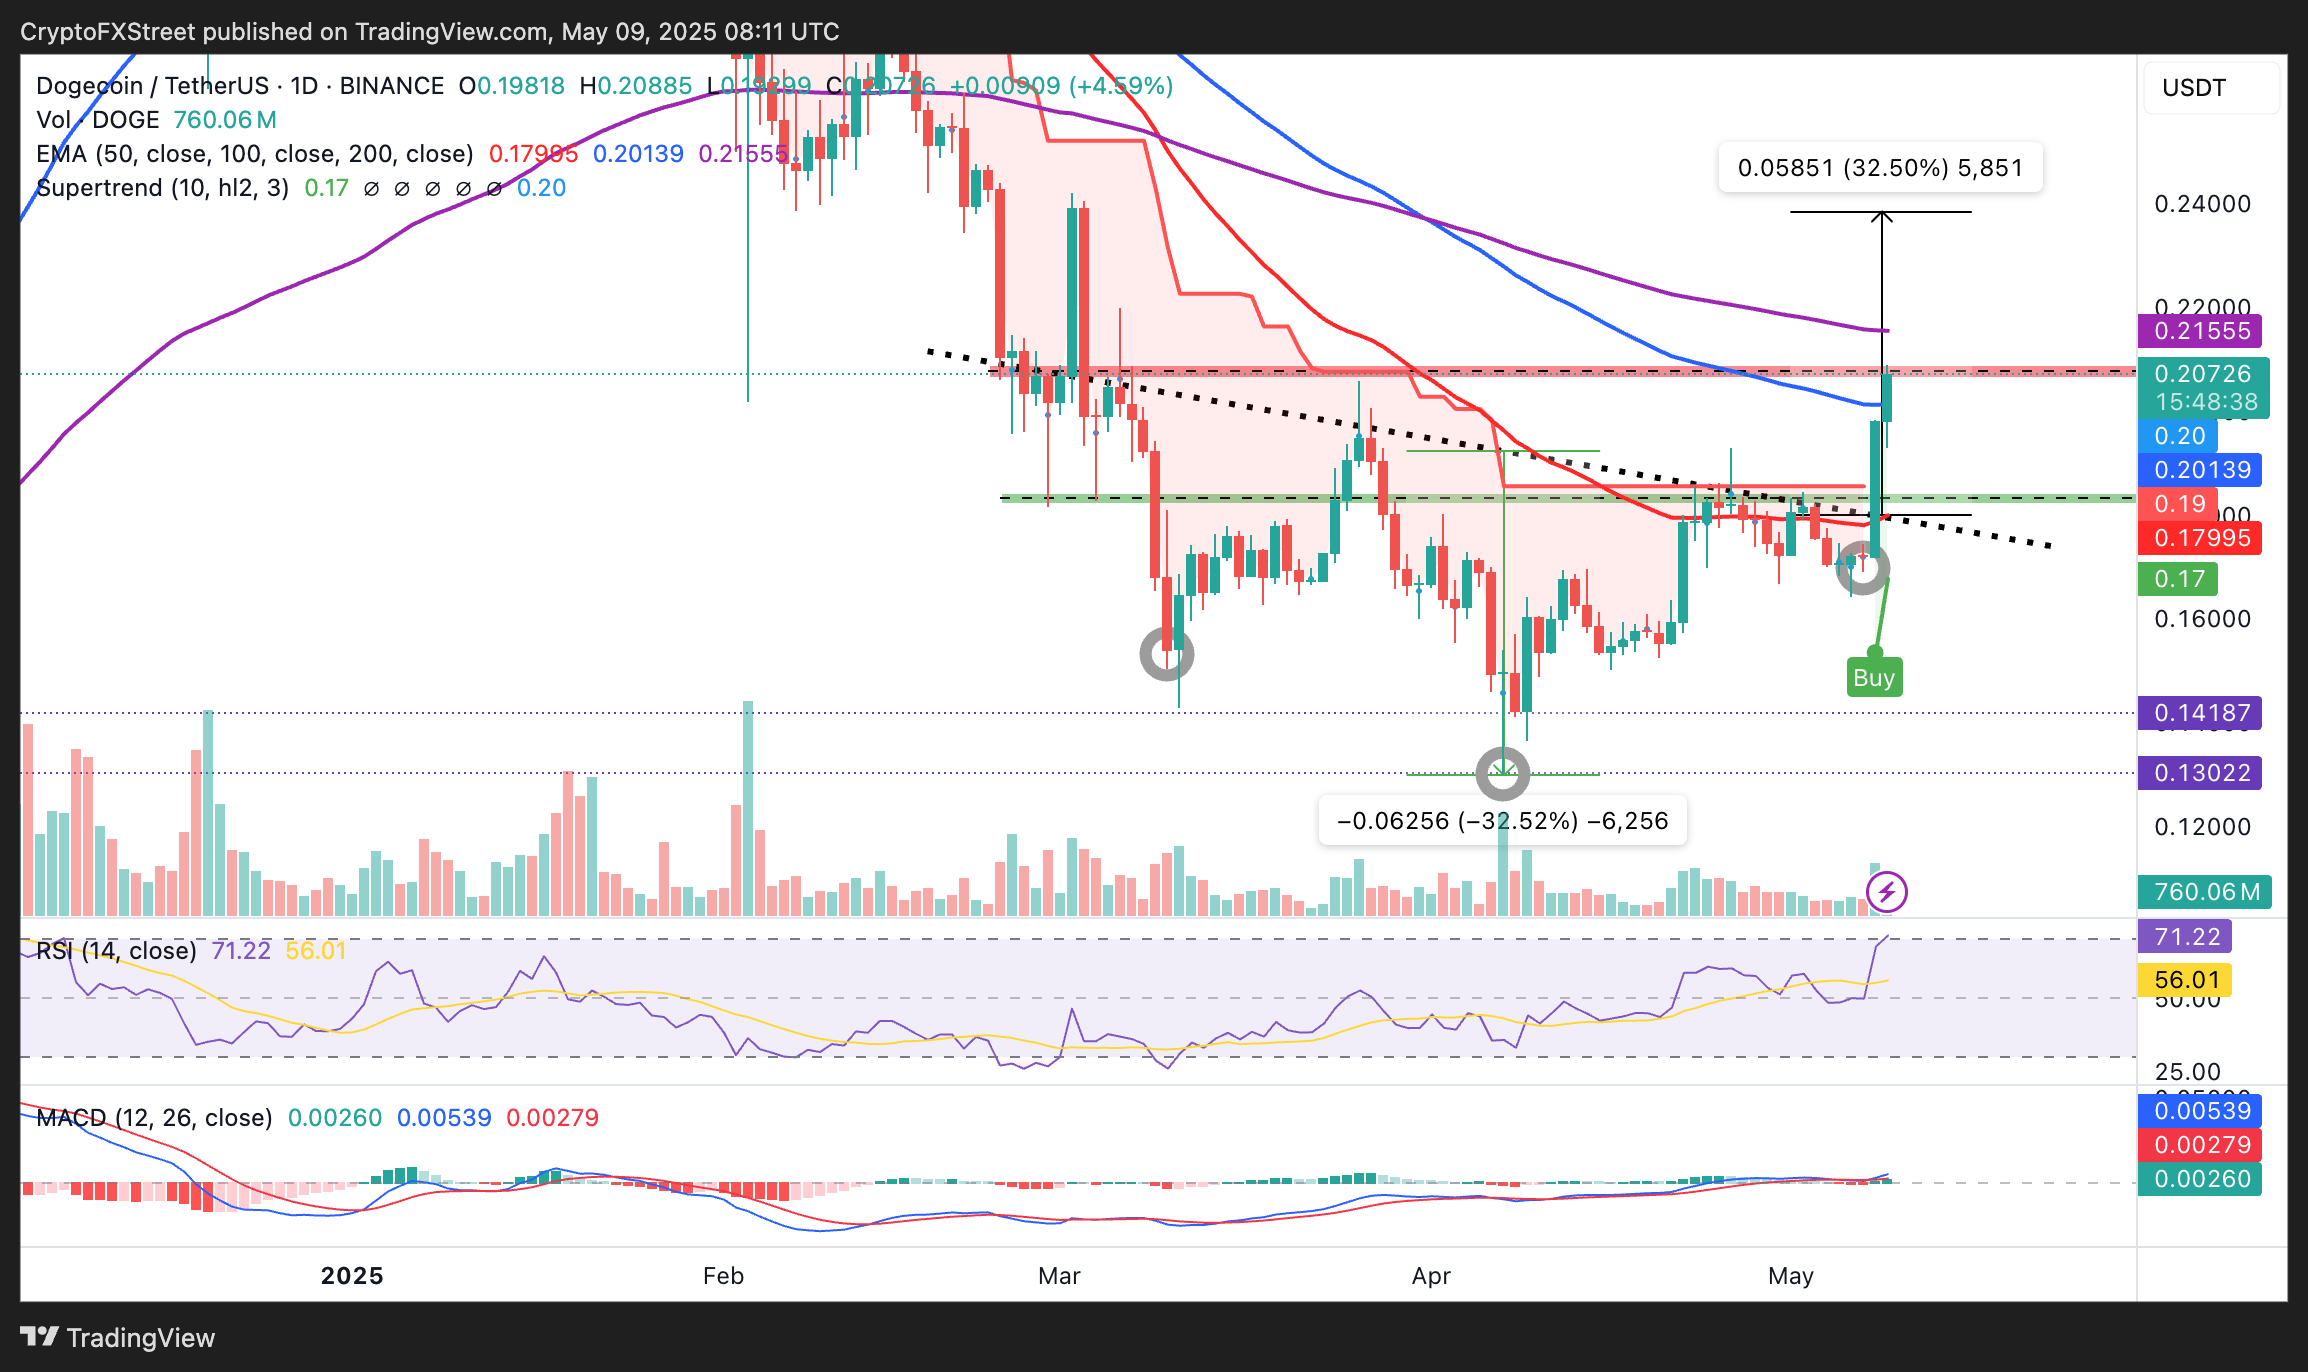
DOGE/USD daily chart
However, traders must prepare for different outcomes as Dogecoin's price rallies, including a potential reversal. The Relative Strength Index (RSI) indicator is entering the overbought region at 70.31, implying a robust uptrend.
Notably, oversold conditions often precede drawdowns due to profit-taking and other market dynamics. If DOGE pulls back beyond the 100-day EMA at $0.20, traders would look to the 50-day EMA at $0.18 for support and liquidity before attempting another breakout.
Read more
* The content presented above, whether from a third party or not, is considered as general advice only. This article should not be construed as containing investment advice, investment recommendations, an offer of or solicitation for any transactions in financial instruments.


