

Analyst Says Bitcoin Fun Will Begin When This Flip Happens

- Silver Price Forecast: Trump Signals Rapid Progress in US-Iran Negotiations, Bulls Target $90
- Gold declines below $4,500 as Iran tensions stoke inflation fears and bolster Fed hike bets
- $1.5 Billion in Crypto Assets Liquidated, Bitcoin Falls Below $66,000 Mark. What Is the Reason?
- Bitcoin Suffers Year’s Strongest Waterfall-Style Decline. Will It Next Drop to the $60,000 Mark?
- WTI rises to near $93.00 as Iran launches missiles toward Kuwait, Bahrain
- Bitcoin drops below $65K amid reinforced bear market signals

An analyst has explained how a crossover between these two Bitcoin metrics would have to happen before the ‘fun’ can begin for the asset.
Bitcoin Realized Price Is Yet To Flip 200-Week MA
In a new post on X, analyst James Van Straten has discussed about the Realized Price and 200-week moving average (MA) for Bitcoin. The “Realized Price” here refers to an on-chain indicator that, in short, keeps track of the cost basis or acquisition price of the average investor on the BTC network.
When the spot price of the cryptocurrency is greater than this metric, it means the holders as a whole are in a state of net unrealized profit. On the other hand, it being under the indicator suggests the overall market is holding loss.
The 200-week MA, the other metric of interest here, is an indicator from technical analysis. An MA is a tool that calculates the average value of a given quantity over a specified time period and as its name implies, moves with time.
MAs are useful for studying long-term trends, as they remove all the short-term kinks out of an asset’s price chart. Certain MAs are considered to carry more significance than the other, with one such period being 200 weeks.
Below is the chart shared by the analyst that shows the trend in the Bitcoin Realized Price and 200-week MA over the past several years.
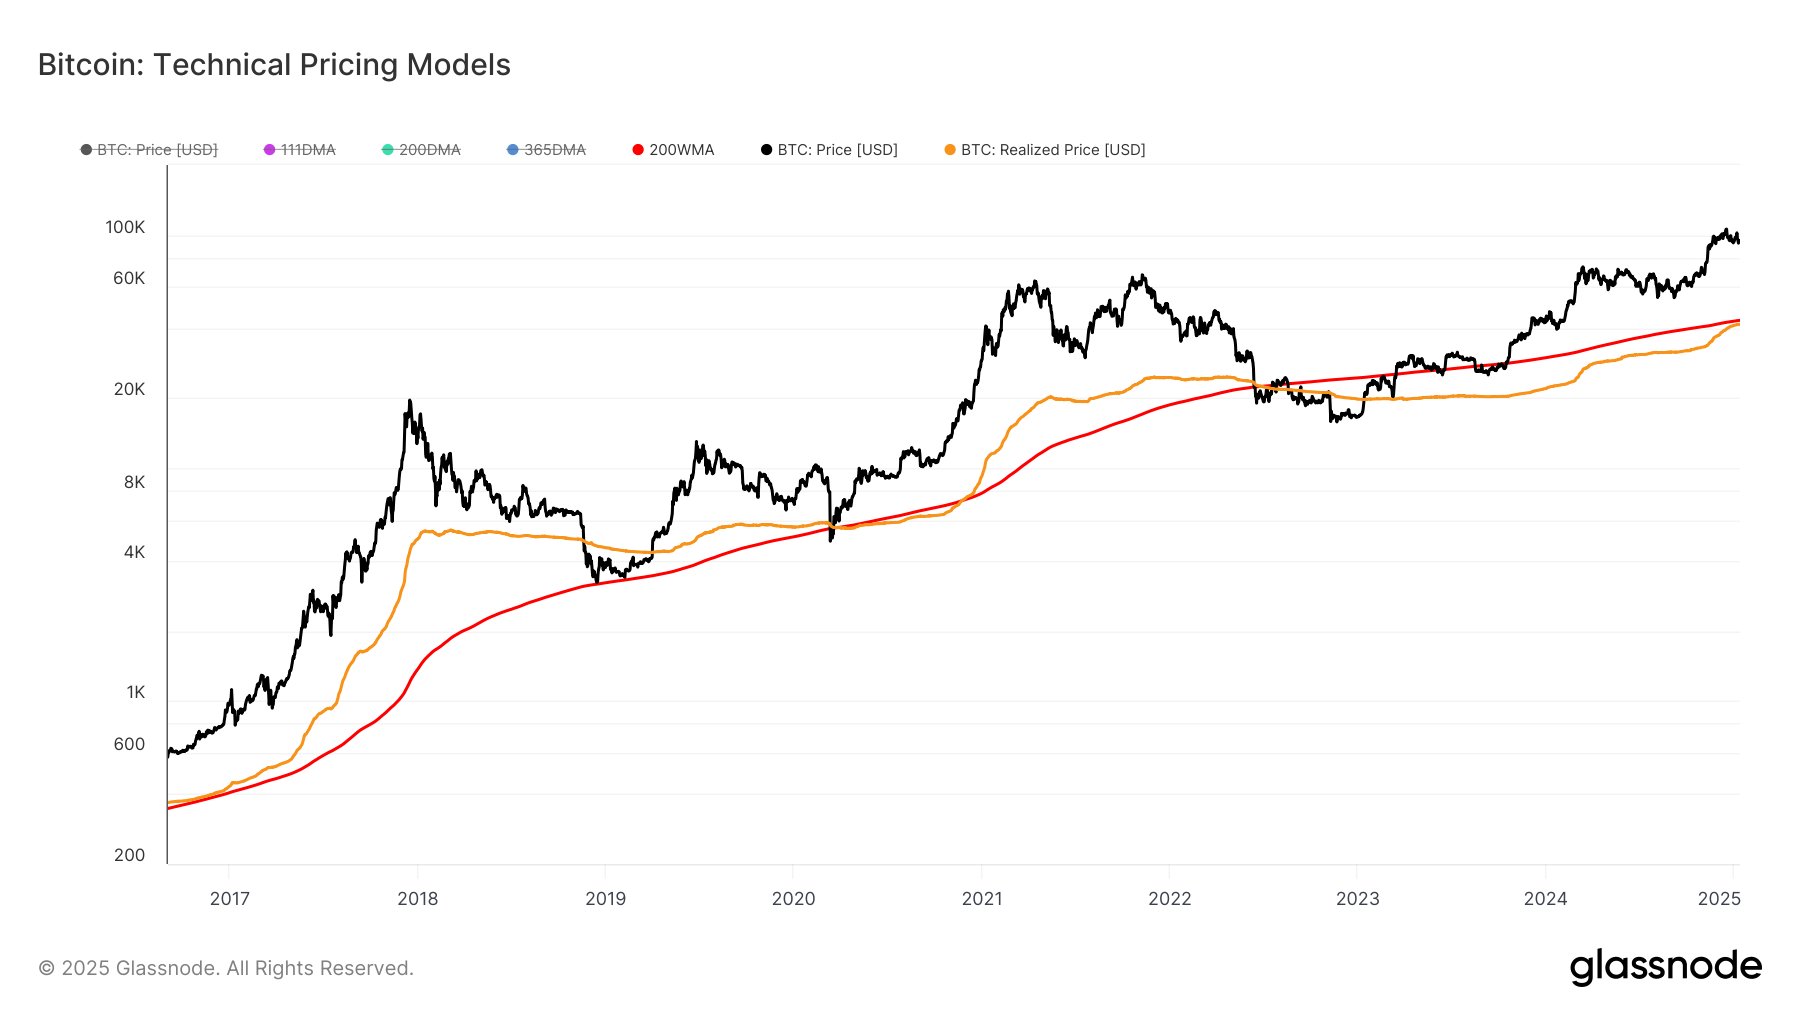
As is visible in the graph, the Bitcoin Realized Price fell under the 200-week MA back during the 2022 bear market. Since then, the metric has remained under the line, but recently, it has been fast approaching a retest.
From the chart, it’s apparent that previous crosses for the indicator above the MA led to full-blown bull runs for the cryptocurrency. “When the realized price flips the 200WMA the fun begins,” notes Van Straten.
Thus, it’s possible that such a crossover could end up being bullish for Bitcoin in the current cycle as well. It only remains to be seen, though, whether the Realized Price would actually end up surpassing the level in the near future or if a rejection is waiting.
On another note, the Realized Price has historically served as the boundary line for the bear market lows in the asset’s price. As mentioned earlier, the majority of the market enters into a state of loss when BTC falls under the metric. There aren’t many sellers left looking to take profits in such a market, which is why the asset tends to reach a bottom during it.
BTC Price
Bitcoin has shown a sharp jump over the past day as its price has recovered to the $96,600 mark after having dropped as low as under $90,000 yesterday.
* The content presented above, whether from a third party or not, is considered as general advice only. This article should not be construed as containing investment advice, investment recommendations, an offer of or solicitation for any transactions in financial instruments.


