

Top 3 Price Prediction Bitcoin, Ethereum, Ripple: BTC, ETH, and XRP consolidate before a potential breakout

- Gold Price Trend Forecast: Expectations of Easing US-Iran Tensions Boost Gold Prices, $4,070 Becomes Key Level for Bulls and Bears
- Gold rallies to over two-week high, eyes $4,150 as traders track US-Iran diplomacy efforts
- Euro declines to near 1.1400 as US launches fresh strikes on Iran
- Tesla Q2 Earnings Preview: Record Deliveries Fail to Hide Profit Pressure, Can Musk Rely on AI and Autonomous Driving to Unlock New Growth Space?
- WTI surges above $83.00 amid escalating US-Iran conflict
- WTI climbs above $87.00 as Middle East conflict threatens key choke points

Bitcoin hovers around $85,600 on Monday after recovering 4.25% last week.
Ethereum price finds support around the $1,861 level, suggesting a recovery on the cards.
XRP trades around $2.41 on Monday after recovering nearly 7% in the previous week.
Bitcoin (BTC) hovers around $85,600 on Monday after recovering 4.25% last week. Ethereum (ETH) and Ripple (XRP) also followed in BTC’s footsteps, hovering around their key levels after recovering almost 7% each the previous week.
Bitcoin bulls aim for $90,000 mark
Bitcoin price broke and closed above its 200-day Exponential Moving Average (EMA) at around $85,502 last week but failed to find support around it.
Moreover, it broke and closed above its 200-day EMA again on Sunday. At the time of writing on Monday, it hovers around $85,600.
If BTC finds support around its 200-day EMA, it could extend the recovery to retest its key psychological level of $90,000.
The Relative Strength Index (RSI) on the daily chart reads 48, pointing upward toward its neutral level of 50, indicating fading bearish momentum. The RSI must move above its neutral level of 50 for the recovery rally to be sustained. The Moving Average Convergence Divergence (MACD) indicator showed a bullish crossover on the daily chart last week, giving a buy signal and suggesting a bullish trend ahead. Additionally, it shows rising green histogram levels above its neutral level of zero, indicating strength in upward momentum.
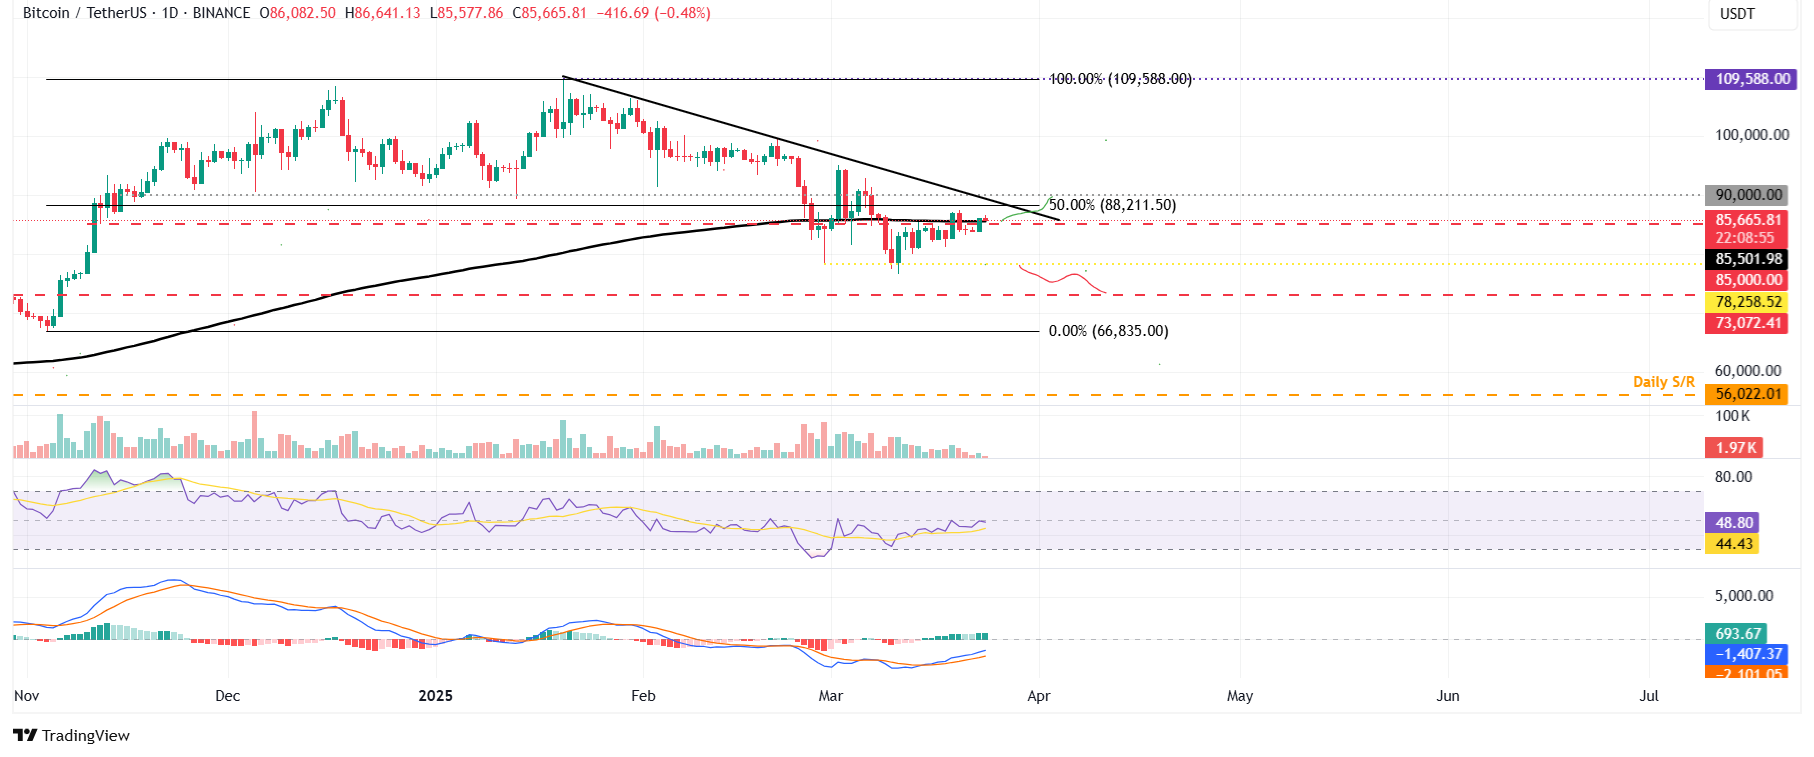
BTC/USDT daily chart
However, if BTC fails to find support around its 200-day EMA and closes below $85,000, it could extend the decline to retest its next support level at $78,258.
Ethereum could extend its recovery if the $1,861 level holds
Ethereum price was retested, and support was found around its daily level of $1,861 for the last two weeks, and it recovered nearly 7% last week. At the time of writing on Monday, it hovers around $1,980.
If the daily support around $1,861 holds, the ETH price could extend the recovery to retest its March 7 high of $2,258.
The RSI on the daily chart reads 40, approaching its neutral level of 50, indicating fading bearish momentum. However, the RSI must move above its neutral level of 50 for the recovery rally to be sustained. The MACD indicator showed a bullish crossover on the daily chart last week, giving a buy signal and suggesting a bullish trend ahead. Additionally, it shows rising green histogram levels above its neutral level of zero, indicating strength in upward momentum.
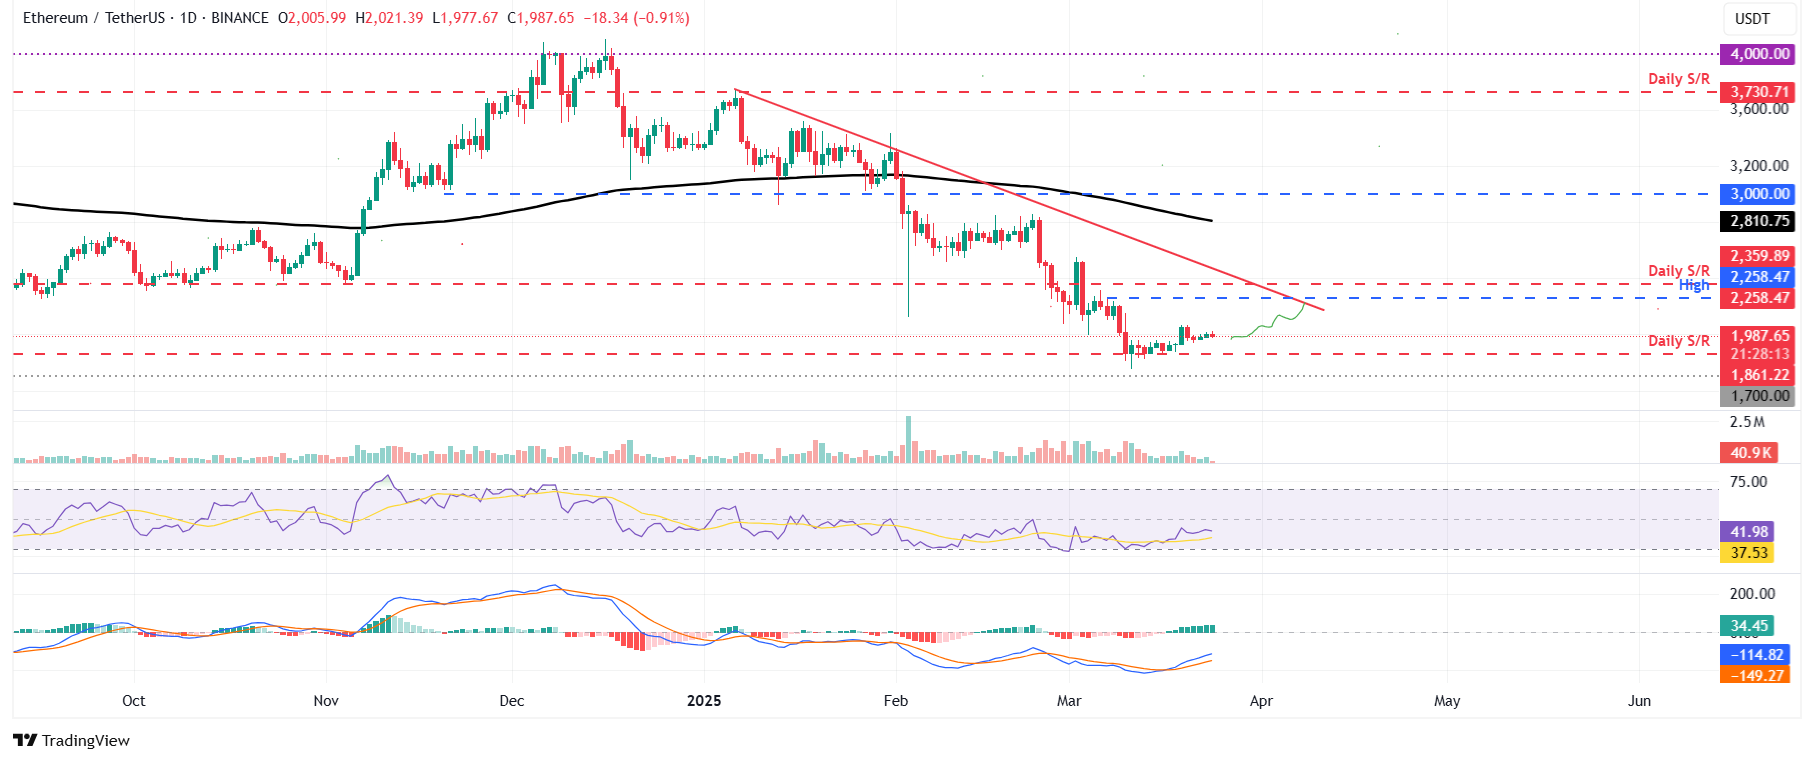
ETH/USDT daily chart
However, if ETH breaks and closes below the daily support at $1,861, it could extend the decline to retest the next support level at $1,700.
Ripple could recover if the break above 100-day EMA is sustained
Ripple price broke above its 100-day EMA at $2.31 last week and recovered almost 7%. At the time of writing on Monday, it hovers around $2.42.
If the 100-day EMA around $2.42 continues to hold, it could extend the recovery to retest its next resistance level at $2.72.
The RSI on the daily chart reads 51, hovering around the neutral level of 50, indicating indecisiveness among the traders. The RSI must point upward and move above its neutral level of 50 to sustain the bullish momentum. The MACD indicator showed a bullish crossover on the daily chart last week, giving a buy signal and suggesting a bullish trend ahead.
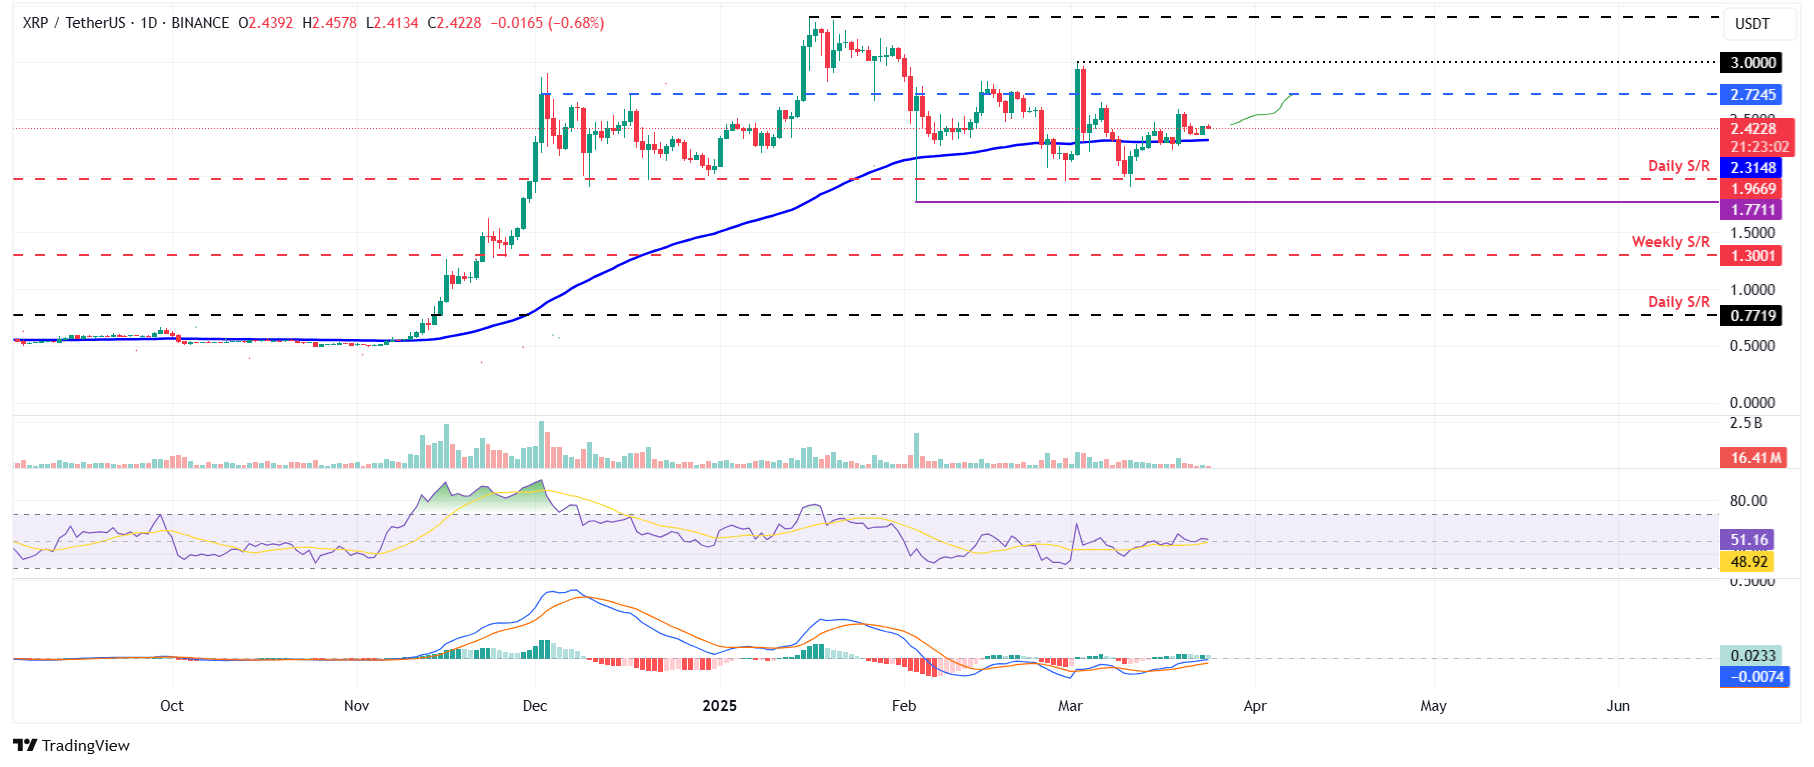
XRP/USDT daily chart
However, if XRP fails to find support around its 100-day EMA and closes below, it could extend an additional decline to test its next support level at $1.96.
Read more
* The content presented above, whether from a third party or not, is considered as general advice only. This article should not be construed as containing investment advice, investment recommendations, an offer of or solicitation for any transactions in financial instruments.


