

Top 3 Price Prediction Bitcoin, Ethereum, Ripple: BTC, ETH and XRP stabilize as SEC Crypto Task Force prepares for First roundtable discussion

- Gold Price Forecast: Gold Poised to Break $4,200 as Oil Price Slump Eases Inflation Fears
- Gold Price Forecast: Oil Price Breaking $100 Fuels Inflation Concerns, Will Gold Prices Fall Further?
- Gold Price Trend Forecast: Expectations of Easing US-Iran Tensions Boost Gold Prices, $4,070 Becomes Key Level for Bulls and Bears
- Gold rallies to over two-week high, eyes $4,150 as traders track US-Iran diplomacy efforts
- Middle East War updates: US-Iran pause strikes as Trump weighs up diplomatic options
- Euro declines to near 1.1400 as US launches fresh strikes on Iran

Bitcoin price hovers around $84,500 on Friday after recovering nearly 3% so far this week.
Ethereum price finds support around the $1,861 level, suggesting a recovery on the cards.
XRP breaks and retests its support level around the 50-day EMA at $2.43, suggesting a bounce ahead.
Bitcoin (BTC) price hovers around $84,500 on Friday after recovering nearly 3% so far this week. Ethereum (ETH) and Ripple (XRP) find support around their key levels, suggesting a recovery on their cards.
Moreover, the first-ever roundtable on crypto asset regulation by the US Securities and Exchange Commission (SEC) Crypto Task Force will be held on Friday. The roundtable will cover digital assets, cryptocurrencies, tokens, and related protocols. This event could bring volatility to cryptocurrencies as it marks a public step by the SEC to address cryptocurrencies' regulatory uncertainties.
Bitcoin BTC bulls aim for $90,000 if it breaks above its 200-day EMA
Bitcoin price broke and closed above its 200-day Exponential Moving Average (EMA) on Wednesday, reaching a high of $87,000 that day. However, on Thursday, it failed to find support around its 200-day EMA at $85,515 and declined 3%, closing below it. At the time of writing on Friday, it recovers slightly and hovers around $84,500.
If BTC recovers, breaks, and finds support around the 200-day EMA, it could extend the recovery to retest its key psychological level of $90,000.
The Relative Strength Index (RSI) on the daily chart reads 46 after being rejected from its neutral level of 50 on Wednesday, indicating slight bearish momentum. The RSI must move above its neutral level of 50 for the recovery rally to be sustained.
The Moving Average Convergence Divergence (MACD) indicator showed a bullish crossover on the daily chart last week, giving a buy signal and suggesting a bullish trend ahead. Additionally, it shows rising green histogram levels above its neutral level of zero, indicating strength in upward momentum.
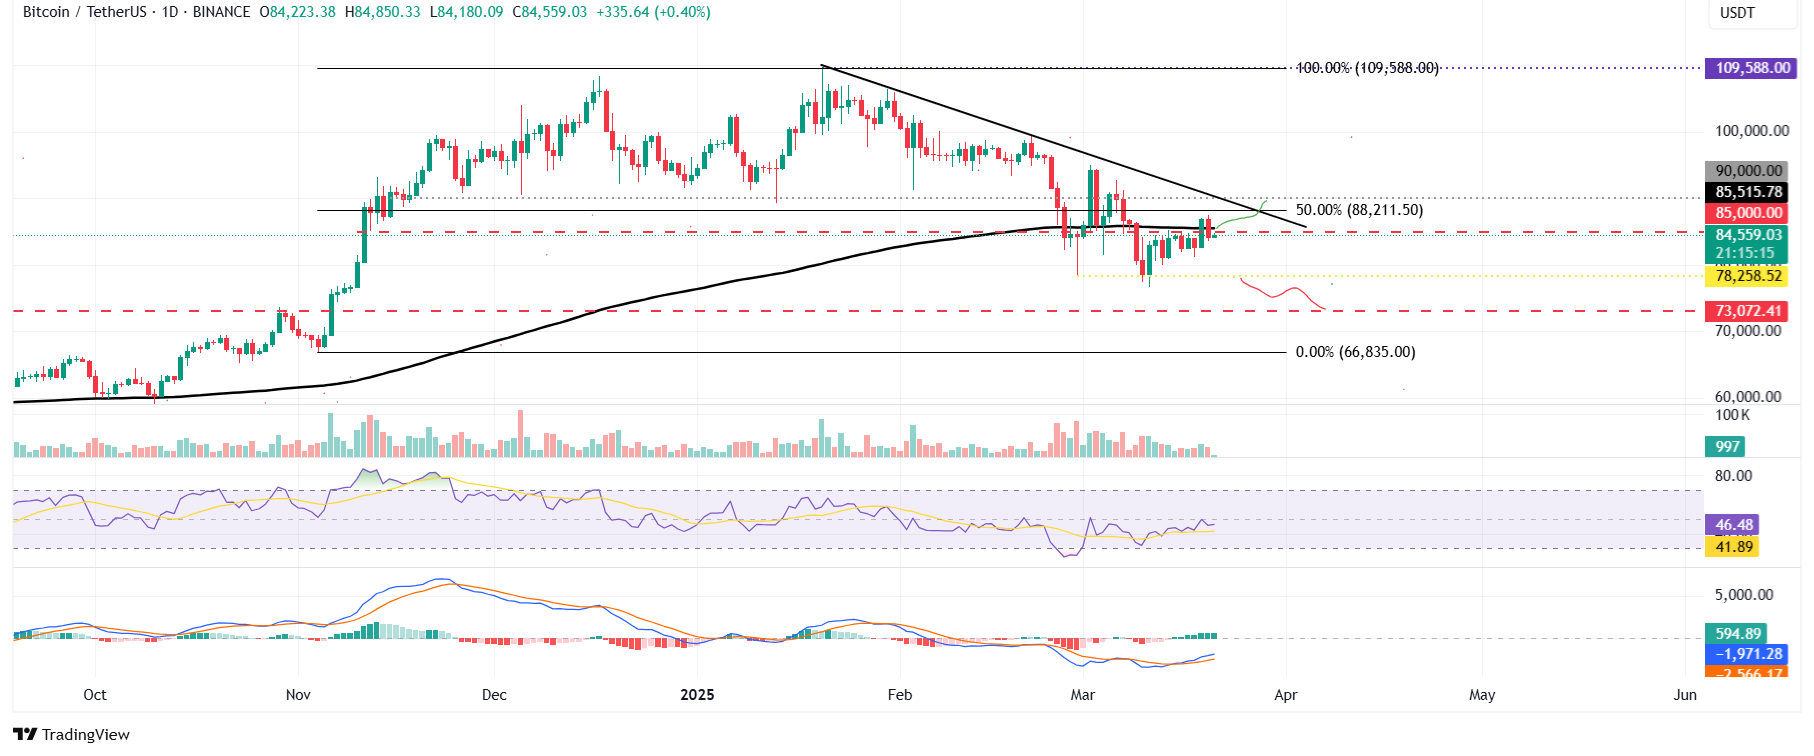
BTC/USDT daily chart
However, if BTC continues its downtrend, it could extend the decline to retest its next support level at $78,258.
Ethereum could recover if its $1,861 level continues to hold as support
Ethereum price was retested, and support was found around its daily level at $1,861 since last week and recovered 9% until Wednesday. However, it declined by 3.5% the next day. At the time of writing on Friday, it hovers around $1,970.
If the daily support around $1,861 holds, the ETH price could extend the recovery to retest its March 7 high of $2,258.
The RSI on the daily chart reads 40 after bouncing off its oversold level of 30 last week, indicating fading bearish momentum. However, the RSI must move above its neutral level of 50 for the recovery rally to be sustained. The MACD indicator showed a bullish crossover on the daily chart on Monday, giving a buy signal and suggesting a bullish trend ahead. Additionally, it shows rising green histogram levels above its neutral level of zero, indicating strength in upward momentum.
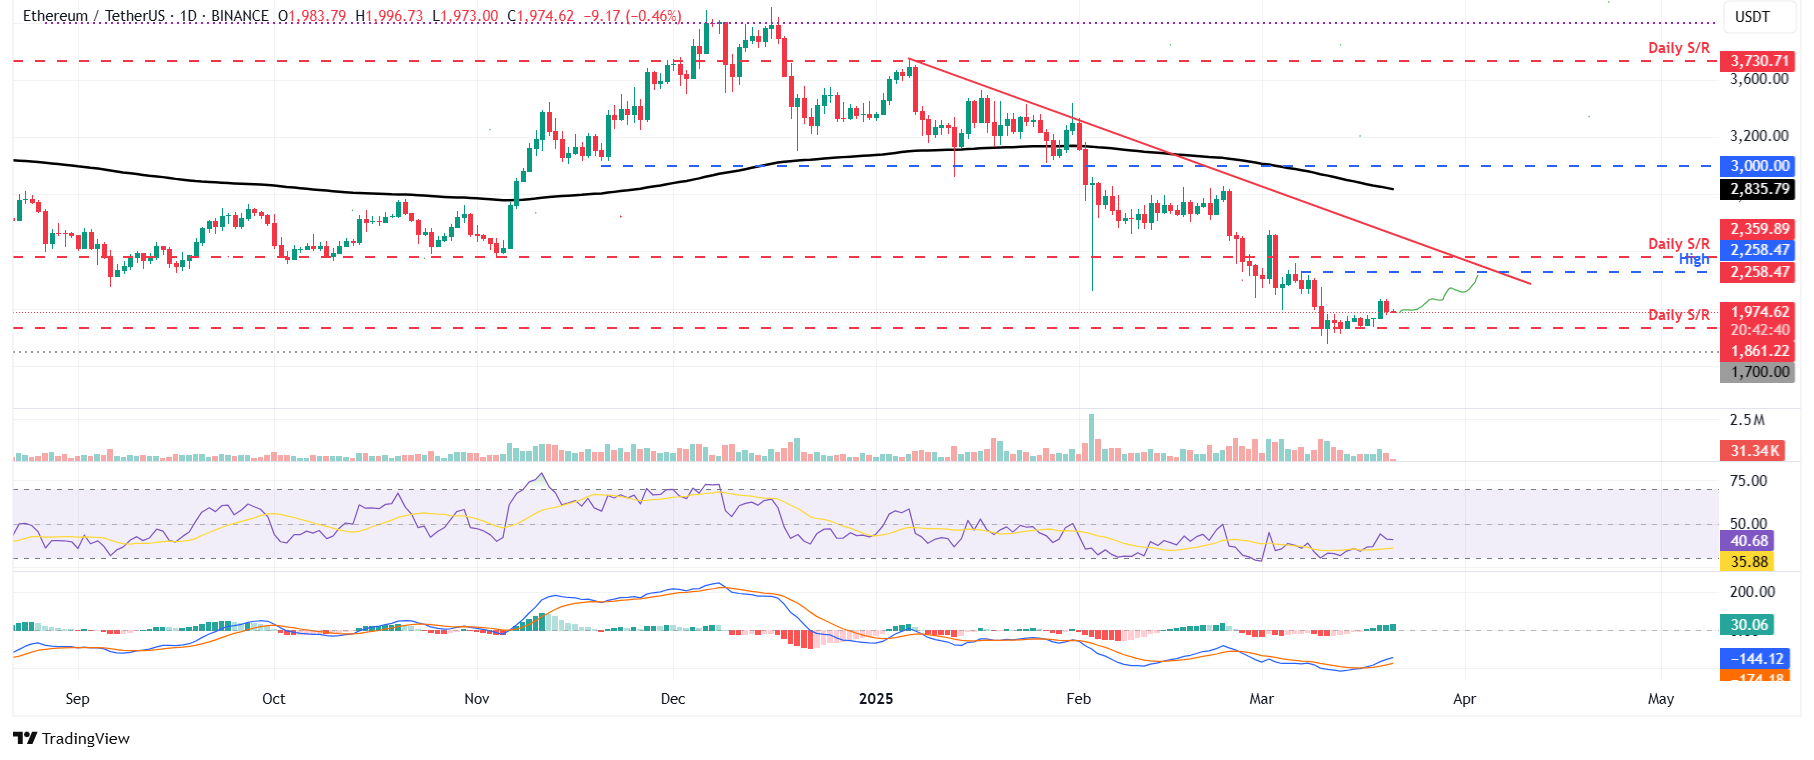
ETH/USDT daily chart
On the other hand, if ETH breaks and closes below the daily support at $1,861, it could extend the decline to retest the next support level at $1,700.
Ripple could recover if its 50-day EMA holds
Ripple price broke above its 50-day EMA at $2.43 on Wednesday and rallied 11.46%. However, it declined slightly, retesting its 50-day EMA the next day. At the time of writing on Friday, it trades around $2.42.
If XRP finds support around the 50-day EMA, it could extend the recovery to retest its $2.72 level.
The RSI on the daily chart reads 51, hovering around the neutral level of 50, indicating indecisiveness among the traders. The RSI must point upward and move above its neutral level of 50 for the bullish momentum to be sustained. The MACD indicator showed a bullish crossover on the daily chart last week, giving a buy signal and suggesting a bullish trend ahead.
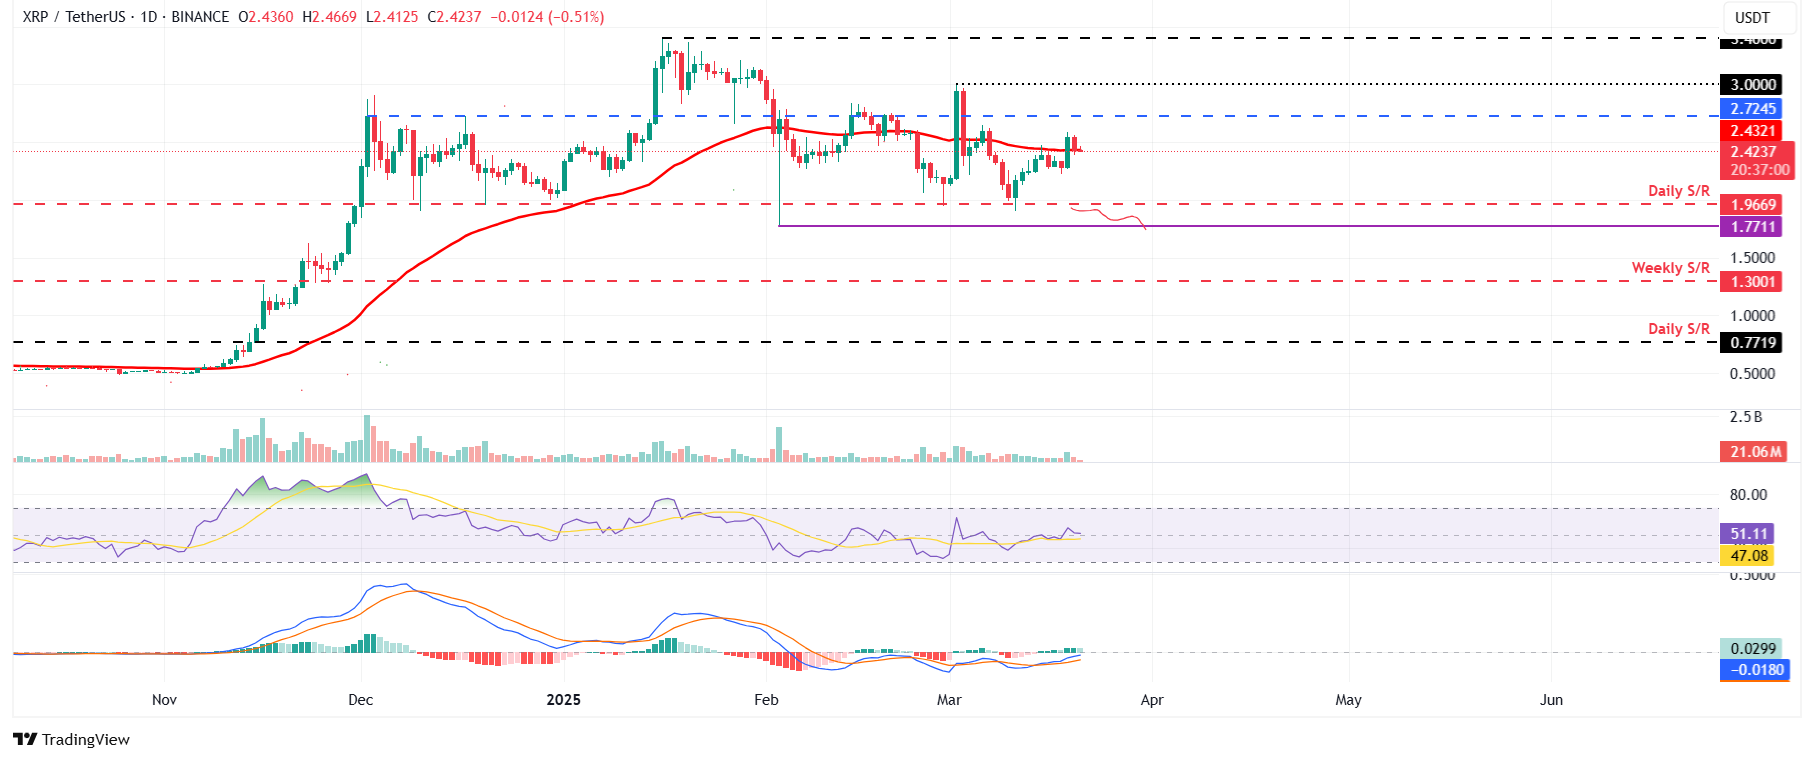
XRP/USDT daily chart
However, if XRP fails to find support around its 50-day EMA and closes below, it could extend an additional decline to test its next support level at $1.96.
Read more
* The content presented above, whether from a third party or not, is considered as general advice only. This article should not be construed as containing investment advice, investment recommendations, an offer of or solicitation for any transactions in financial instruments.


