

Top 3 Price Prediction Bitcoin, Ethereum, Ripple: BTC, ETH and XRP expect volatility around the FOMC meeting

- Gold Price Forecast: Gold Poised to Break $4,200 as Oil Price Slump Eases Inflation Fears
- Gold Price Forecast: Oil Price Breaking $100 Fuels Inflation Concerns, Will Gold Prices Fall Further?
- Gold rallies to over two-week high, eyes $4,150 as traders track US-Iran diplomacy efforts
- Middle East War updates: US-Iran pause strikes as Trump weighs up diplomatic options
- WTI climbs above $87.00 as Middle East conflict threatens key choke points
- Today’s Market Recap: Oil Breaks $100, Fueling Inflation Fears, as AI Capex Faces Scrutiny and Tesla’s 14% Plunge Drags Down Tech Sector

Bitcoin faces resistance around its 200-day EMA at $85,500; a firm close above indicates recovery on the cards.
Ethereum price finds support around the $1,861 level, suggesting a bounce ahead.
XRP faces rejection around the 50-day EMA at $2.50; a close above indicates a recovery ahead.
Bitcoin (BTC) and Ripple (XRP) prices face resistance around their key levels; a firm close above indicates recovery on the cards, while Ethereum (ETH) price finds support at its critical level, suggesting a bounce ahead.
Bitcoin price could recover if it closes above its 200-day EMA
Bitcoin price has faced resistance around the 200-day Exponential Moving Average (EMA) at $85,496 since Friday and trades below it. This level roughly coincides with the daily resistance level at $85,000, making it a key resistance zone. At the time of writing on Wednesday, it trades around $82,600.
The Relative Strength Index (RSI) indicator suggests a strength in momentum on the daily chart. The lower low in the Bitcoin price formed on March 11 does not reflect the RSI higher high for the same period. This development is termed a bullish divergence, often leading to a trend reversal or short-term rally.
If bullish divergence plays a part and BTC closes above its 200-day EMA at $85,496, it could extend the recovery to $90,000.
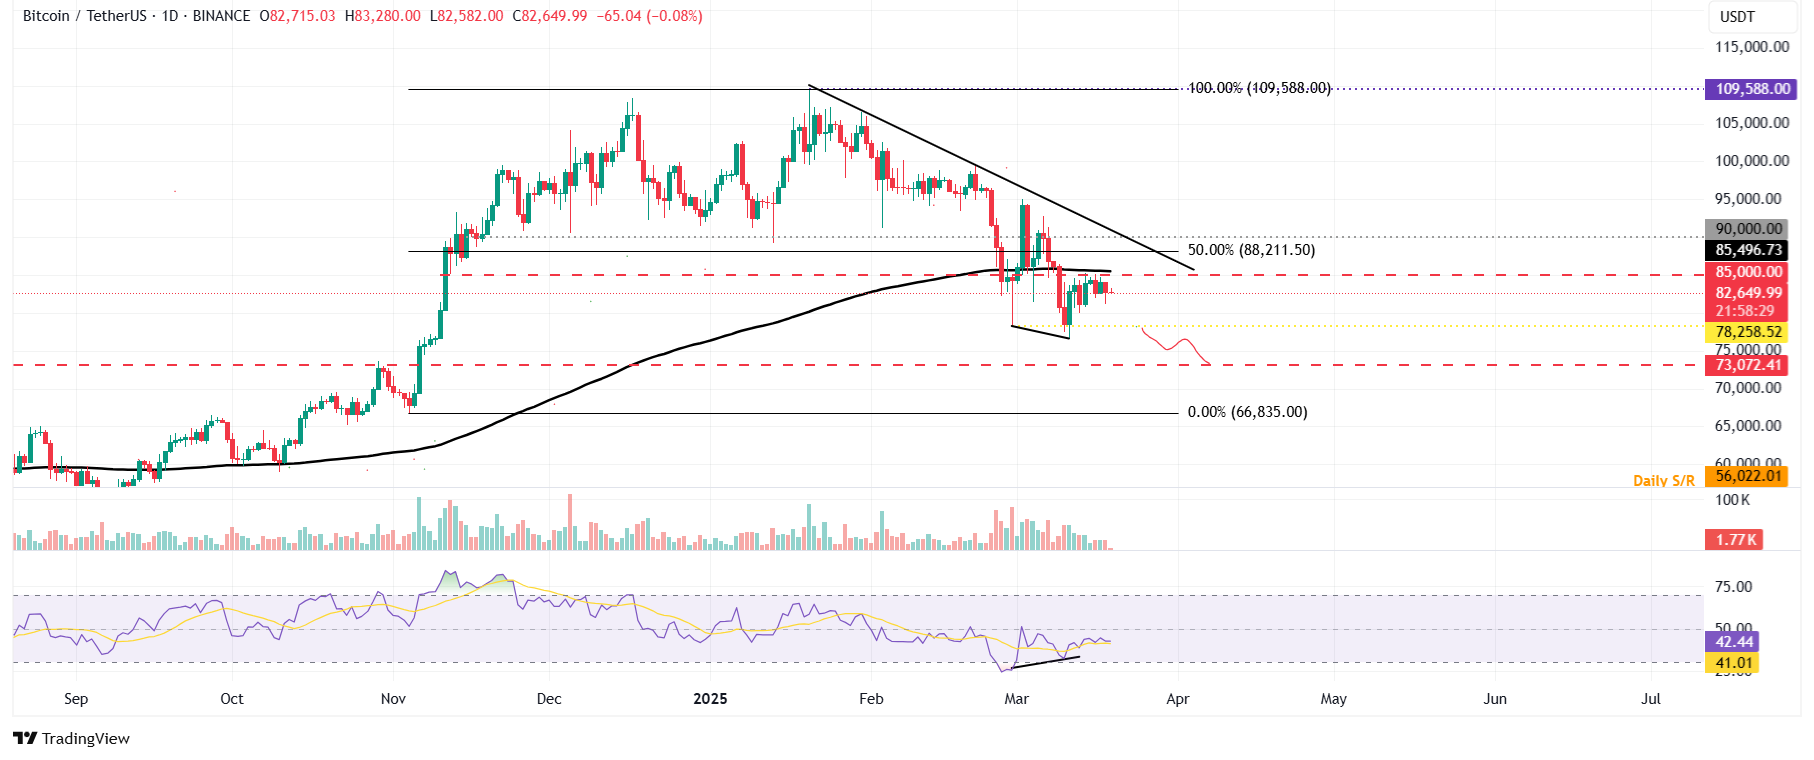
BTC/USDT daily chart
However, if BTC corrects and closes below $78,258 (February 28 low), it could extend the decline to retest its next support level at $73,072.
Ethereum could recover if its $1,861 level continues to hold as support
Ethereum price was retested, and support was found around its daily level at $1,861 since last week. At the time of writing on Wednesday, it is trading slightly above $1,930.
If the daily support around $1,861 holds, the ETH price could extend the recovery to retest its March 7 high of $2,258.
The RSI on the daily chart reads 36 after bouncing off its oversold level of 30 last week, indicating fading bearish momentum. However, the RSI must move above its neutral level of 50 for the recovery rally to be sustained.
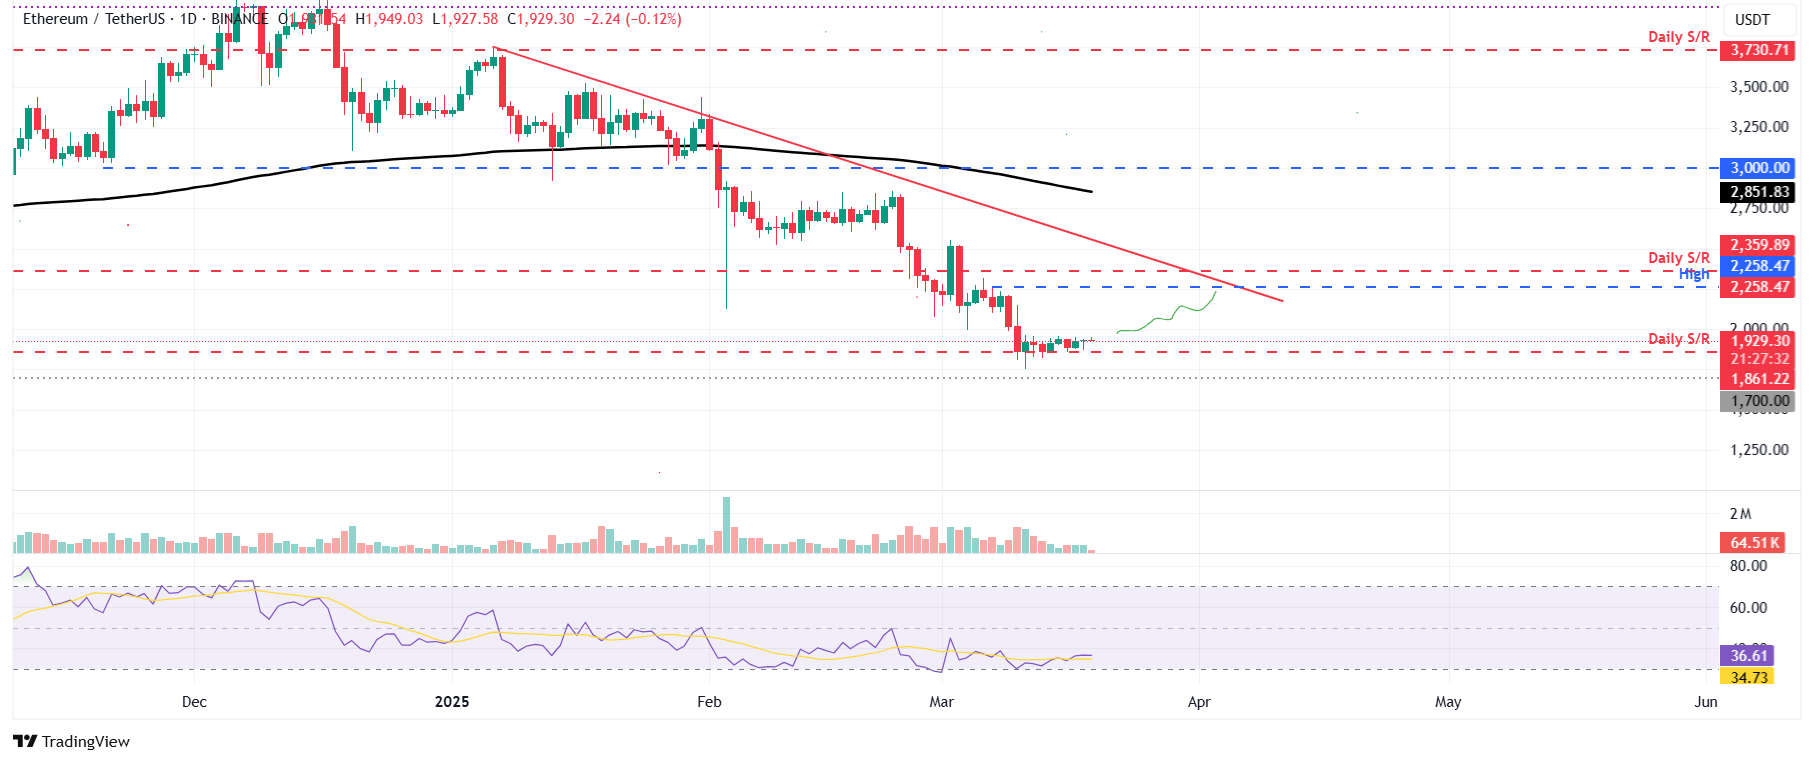
ETH/USDT daily chart
On the other hand, if ETH breaks and closes below the daily support at $1,861, it could extend the decline to retest the next support level at $1,700.
XRP momentum indicator displays indecisiveness among the traders
Ripple price retested its daily support of $1.96 on March 11 and recovered 10.14% in the next 4 days. However, it faced resistance around the 50-day EMA at around the $2.50 level on Saturday, declining 4.38% until Tuesday. At the time of writing on Wednesday, it trades at around $2.27.
If XRP breaks and closes above the 50-day EMA at $2.50, it could extend the recovery to retest its $2.72 level.
The RSI on the daily chart reads 46, hovering around the neutral level of 50, indicating indecisiveness among the traders. For the bullish momentum to be sustained, the RSI must move above its neutral level of 50

XRP/USDT daily chart
However, if XRP faces a correction and closes below $1.96 daily support, it could extend an additional decline to test its February 3 low of $1.77.
Read more
* The content presented above, whether from a third party or not, is considered as general advice only. This article should not be construed as containing investment advice, investment recommendations, an offer of or solicitation for any transactions in financial instruments.


