

Top 3 Price Prediction Bitcoin, Ethereum, Ripple: BTC & ETH rebound, XRP rallies ahead of CPI data

- Silver Price Forecast: Trump Signals Rapid Progress in US-Iran Negotiations, Bulls Target $90
- Forex Today: Yet to be confirmed US-Iran MOU caps US Dollar's upside
- Gold declines below $4,500 as Iran tensions stoke inflation fears and bolster Fed hike bets
- Fed’s Powell says credibility lost if President can fire officials
- $1.5 Billion in Crypto Assets Liquidated, Bitcoin Falls Below $66,000 Mark. What Is the Reason?
- WTI rises to near $93.00 as Iran launches missiles toward Kuwait, Bahrain

Bitcoin price rebounds after retesting its key psychological level at $90,000.
Ethereum price finds support around its 200-day EMA at $3,114, eyeing a recovery ahead.
Ripple price found support around its upper symmetrical triangle throwback, suggesting a rally ahead.
Bitcoin (BTC) and Ethereum (ETH) prices continue to recover on Wednesday after finding support around their key levels this week. On the other hand, Ripple (XRP) remains strong and found support around its upper symmetrical triangle boundary, suggesting a rally continuation.
Bitcoin rebounds after retesting its $90,000 support level
Bitcoin price dipped, reaching a low of $89,256, but recovered quickly and closed above $94,500 on Monday. On Tuesday, it rebounded by 2.14% and closed above $96,500. At the time of writing on Wednesday, it continues its recovery, trading around $97,400.
If BTC continues its recovery and closes above the $100,000 level, it could extend the rally to retest the December 17, 2024, all-time high of $108,353.
The Relative Strength Index on the daily chart reads 53, above its neutral level of 50 and points upwards, indicating a rise in bullish momentum. Additionally, the Moving Average Convergence Divergence (MACD) indicator is about to flip a bullish crossover. If the MACD line closes above the signal line, it would give a buy signal and suggest an uptrend.
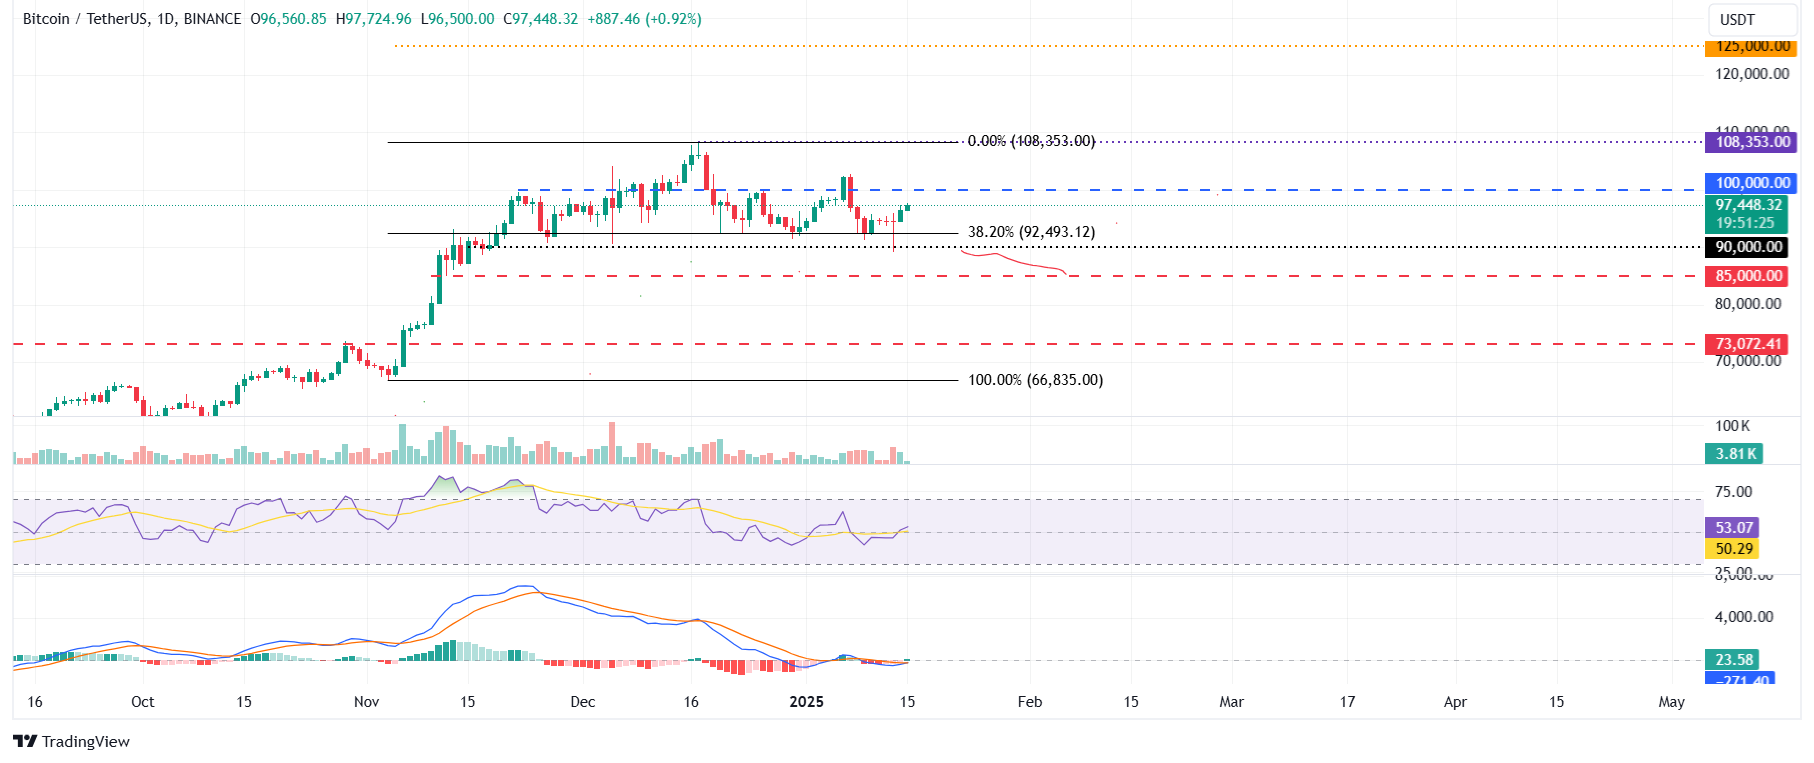
BTC/USDT daily chart
However, if BTC continues its correction and closes below $90,000, it will extend an additional decline to retest its next support level at $85,000.
Ethereum price rebound slightly after retesting its 200-day EMA
Ethereum price faced rejection around the daily resistance level of $3,730 on January 6 and declined 15.47% until Monday, reaching a low of $2,920. However, it rebounded and closed above its 200-day Exponential Moving Average (EMA) at $3,114 and recovered 2.81% the next day. At the time of writing on Wednesday, it hovers around $3,223.
If ETH continues its rebound and closes above $3,235, it could extend the recovery to test its daily resistance level at $3,730.
However, the RSI indicator on the daily chart reads 41, below its neutral level of 50, indicating bearish momentum. The MACD indicator also shows a bearish crossover, suggesting a sell signal and a downtrend.
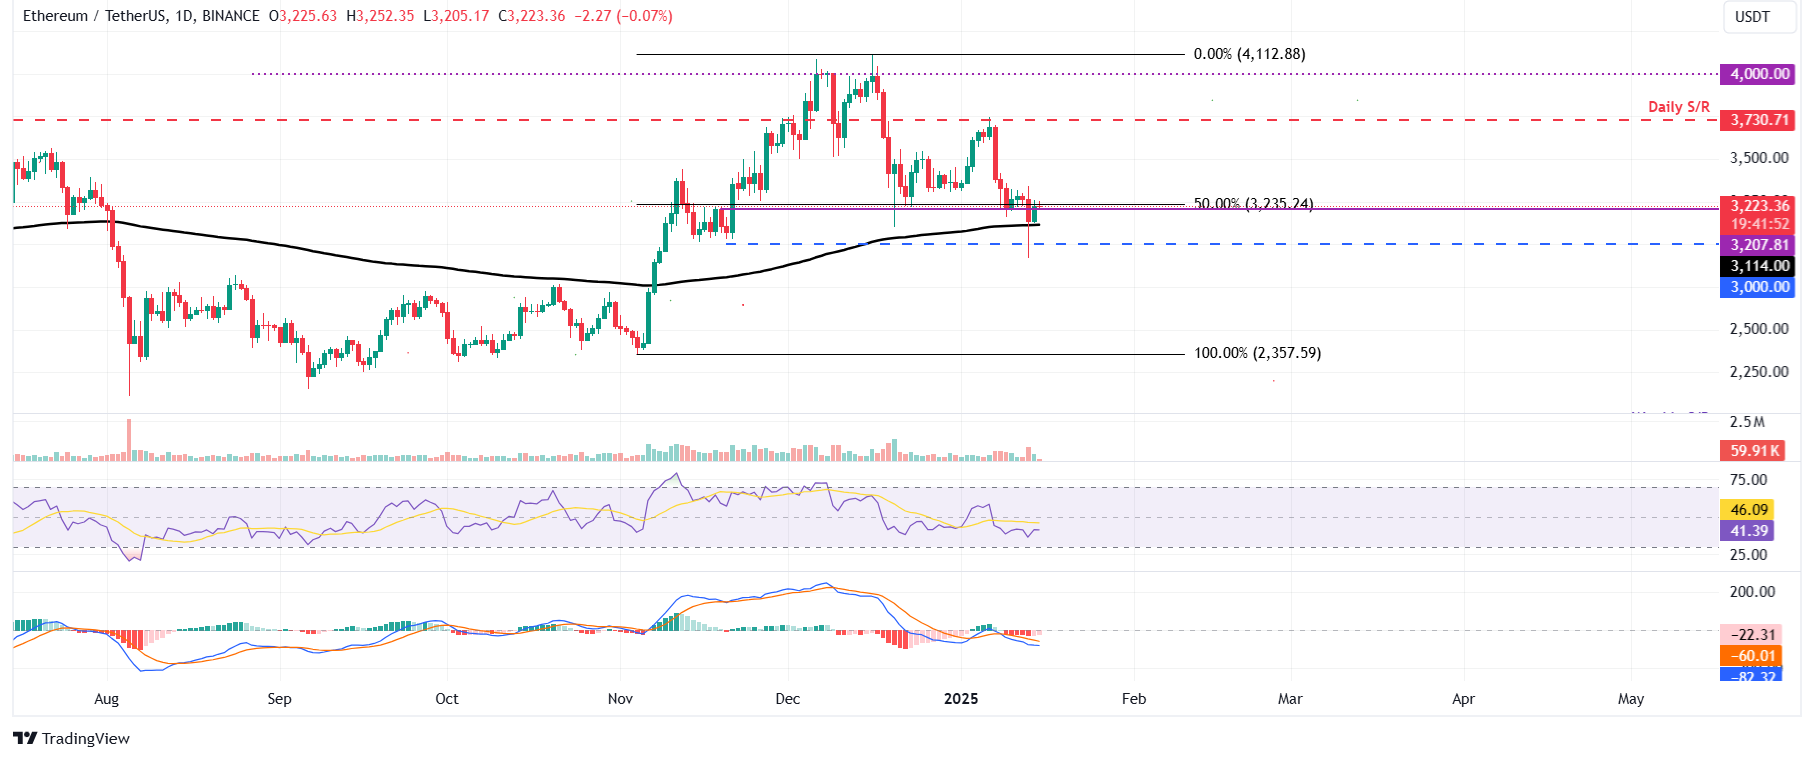
ETH/USDT daily chart
On the other hand, If ETH closes below the $3,114 support level, it could extend the decline to test its psychological importance level of $3,000.
Ripple bulls eye the $3 mark
Ripple price retested its upper symmetrical triangle boundary of the symmetrical triangle pattern on Tuesday and rallied 5.17% the next day. This technical pattern was formed by connecting multiple highs and lows with two converging trendlines (from early December to early January). This technical pattern has a bullish bias, and the target is generally obtained by measuring the distance between the first swing high and the first swing low to the breakout point. At the time of writing on Wednesday, it continues to trade higher around $2.80.
If XRP continues its upward momentum, it could extend the rally to test its technical target obtained by this pattern, which would be $3.63. Investors should be cautious of this theoretical move as it could face a slowdown after testing its psychological importance level of $3.00 as traders could opt to book profits.
The RSI indicator reads 67, above its neutral value of 50, indicating bullish momentum. Additionally, the MACD shows a bullish crossover, suggesting a continuation of an upward trend.
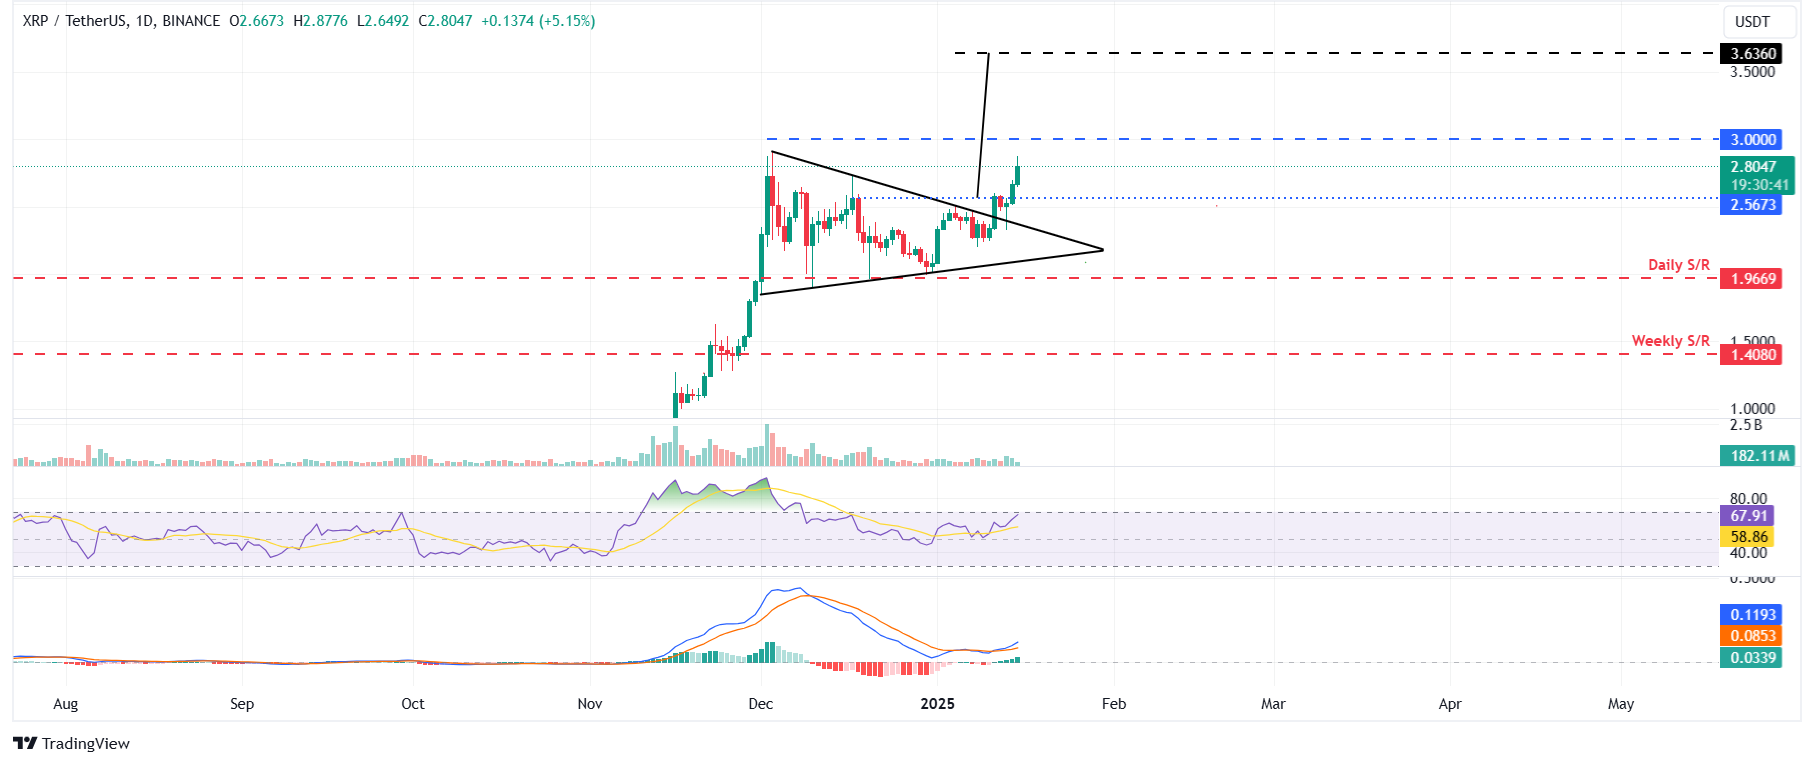
XRP/USDT daily chart
However, if XRP closes below the $1.96 daily support level, it would extend the decline to retest its next support level at $1.40.
Read more
* The content presented above, whether from a third party or not, is considered as general advice only. This article should not be construed as containing investment advice, investment recommendations, an offer of or solicitation for any transactions in financial instruments.


