


Bitcoin Price Forecast: BTC steadies around $115,000 after rollercoaster weekend

- Bitcoin Drops to $70,000. U.S. Government Refuses to Bail Out Market, End of Bull Market or Golden Pit?
- Gold rallies further beyond $5,050 amid flight to safety, dovish Fed expectations
- Bitcoin Bottom Debate: $70,000 or $50,000?
- Bitcoin Slips Below 75,000 Mark. Will Strategy Change Its Mind and Sell?
- Bitcoin Rout. Bridgewater Founder Dalio Publicly Backs Gold.
- Ethereum Price Forecast: ETH faces heavy distribution as price slips below average cost basis of investors

Bitcoin price reclaims $115,000 on Monday after a sharp dip to $102,000 on Friday, which triggered billions in liquidations.
Cautious market sentiment persists amid rising geopolitical tensions and renewed US-China trade concerns.
Institutional demand remained strong as ETFs recorded $2.7 billion in weekly inflows and barely moved on Friday despite the crash.
Bitcoin (BTC) price rebounds to $115,000 on Monday, following a turbulent price drop on Friday, with BTC reaching a low of $102,000. Despite the price volatility in BTC, institutional demand remained strong last week, highlighting continued confidence in BTC, even as market participants stay cautious amid geopolitical tensions and renewed US-China trade concerns.
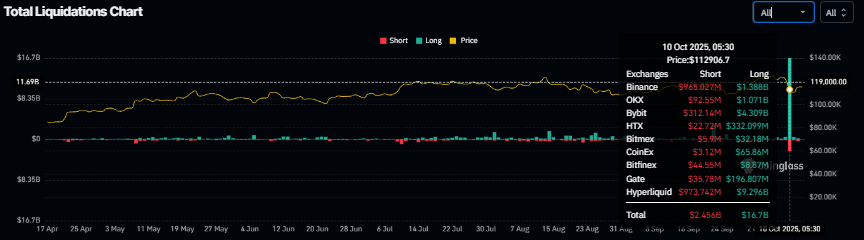
Billions wiped out from the crypto market
CoinGlass Total Liquidation chart below shows that on Friday, $16.7 billion in long positions and $2.45 billion in shorts were liquidated from the overall crypto market, the highest liquidations so far this year.
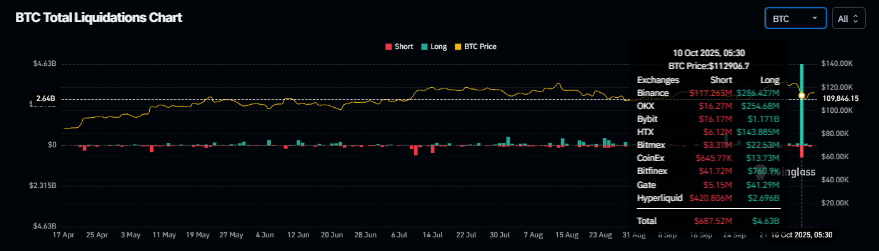
Meanwhile, the BTC total liquidation chart also shows that over $4.63 billion longs and $687.52 million short positions were wiped out on Friday as BTC hit a low of $102,000, levels not seen since the end of June.
This sudden drop in prices resulted from US President Donald Trump's plan to raise tariffs on Chinese goods. Trump's announcement that the US is planning a 100% increase in levies on Chinese imports beginning on November 1.
These fresh US-China trade concerns turn out to be key factors eroding demand and rising uncertainty, which led to a fall in price for the largest cryptocurrency by market capitalization on Friday.
Apart from this, the US government shutdown appears set to extend into a third week, weighing on investor confidence as Congress remains deadlocked over a funding agreement. Moreover, the Senate isn’t scheduled to hold any votes until Tuesday afternoon. Top House leaders signaled that there is virtually no appetite for their parties to cross the aisle and engage with the other side’s demands. President Trump blamed Democrats for his decision to lay off thousands of federal employees, who began receiving notices on Friday.
Rising geopolitical tensions weigh on riskier assets
Trump, while aboard Air Force One, warned that he may send long-range Tomahawk missiles that could be used by Ukraine if Russia doesn’t settle the war soon. The President added that the missiles would act as a new step of aggression if introduced in the Russia-Ukraine war.
Russia has cautioned against Ukraine being provided with Tomahawk missiles. This has kept geopolitical risks elevated, adding another layer of pressure on riskier assets such as Bitcoin.
Institutional demand remains strong despite price dips
Institutional demand remained strong last week. SoSoValue data shows that Bitcoin Spot Exchange Traded Funds (ETFS) recorded a weekly inflow of $2.71 billion, marking the second consecutive week of positive flow.
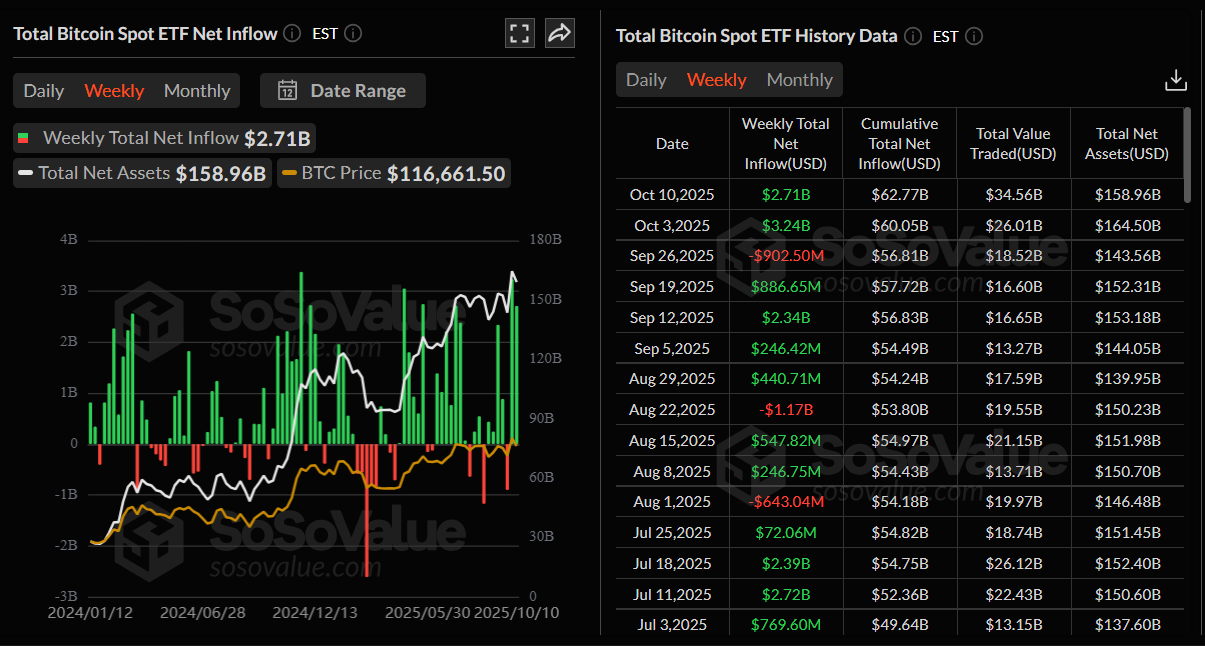
Total Bitcoin Spot ETF net inflow weekly chart. Source: SoSoValue
Moreover, on Friday, Bitcoin ETFs recorded only a modest outflow of $4.5 million, compared to the strong inflows seen earlier in the week, indicating that investor confidence remained largely intact despite the market volatility.
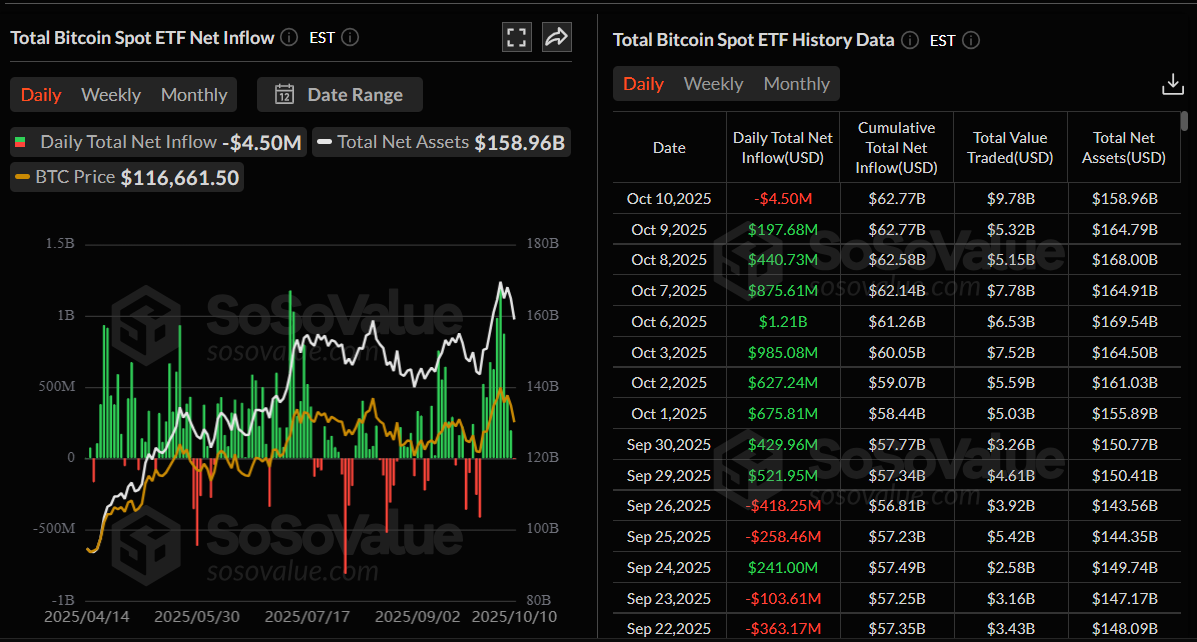
Total Bitcoin Spot ETF net inflow daily chart. Source: SoSoValue
On the corporate front, Lookonhain data shows that MARA Holdings, which holds 52,850 BTC, bought another 400 BTC through FalconX on Monday.

Some signs of optimism
CryptoQuant’s BTC Estimated Leverage Ratio (ELR) has dropped sharply from a yearly high of 0.28 on October 6 to 0.23 on Monday, nearing August lows, indicating a significant reduction in leveraged positions (mostly due to the liquidations seen on Friday) and a potential cooling of speculative activity in the market.
-1760343715211-1760343715212.png)
Bitcoin ELR chart. Source: CryptoQuant
CryptoQuant’s Binance BTC Liquidity Stress Index indicates that Bitcoin is experiencing its highest levels of liquidity stress since the beginning of the year. In such cases, liquidity typically shifts from short-term traders to larger portfolios, indicating that whales and institutions may have taken advantage of this wave to increase their long-term positions at strong support levels.
The continued rise in the Liquidity Stress Index, while the price remains stable, suggests a volatility absorption phase, indicating that the market is rebalancing after a major liquidation wave.
Suppose trading volumes begin to gradually decline over the coming days while the price remains above the $112,000 level. In that case, it will be considered a positive sign of liquidity stabilization and the return of buyers with greater confidence.
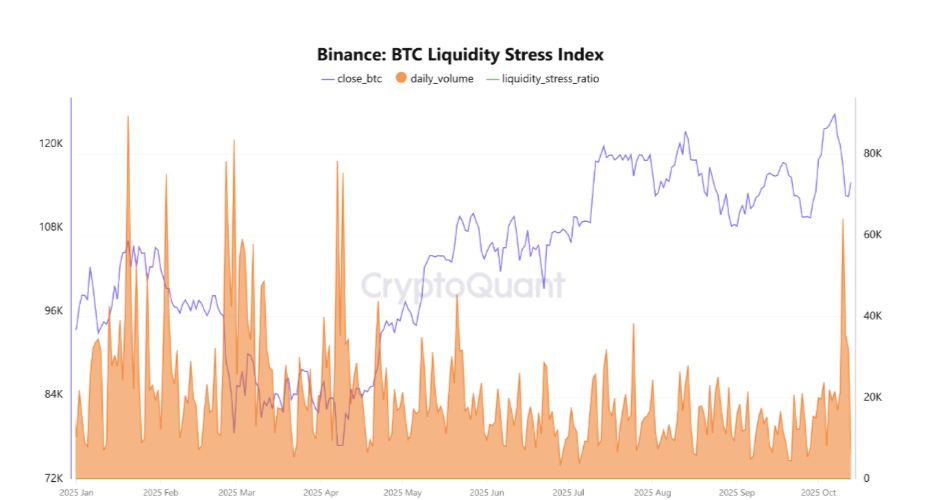
Binance BTC liquidity Stress index. Source: CryptoQuant
Bitcoin Price Forecast: BTC stage mild recovery after sharp correction
Bitcoin price faced rejection after reaching a new all-time high of $126,199 on October 6. It then declined, briefly reaching a daily low of $102,000 on Friday, and fell more than 11% from Tuesday's high to Saturday's low. However, BTC recovered slightly on Sunday, closing above 114,900. At the time of writing on Monday, it hovers at around $115,000.
If BTC continues its recovery, it could retest its key psychological level at $120,000.
The Relative Strength Index (RSI) on the daily chart recovers to 47, nearing the neutral level of 50, indicating fading bearish momentum. However, the Moving Average Convergence Divergence (MACD) indicators still shows a bearish crossover on the daily chart, suggesting bearish momentum.
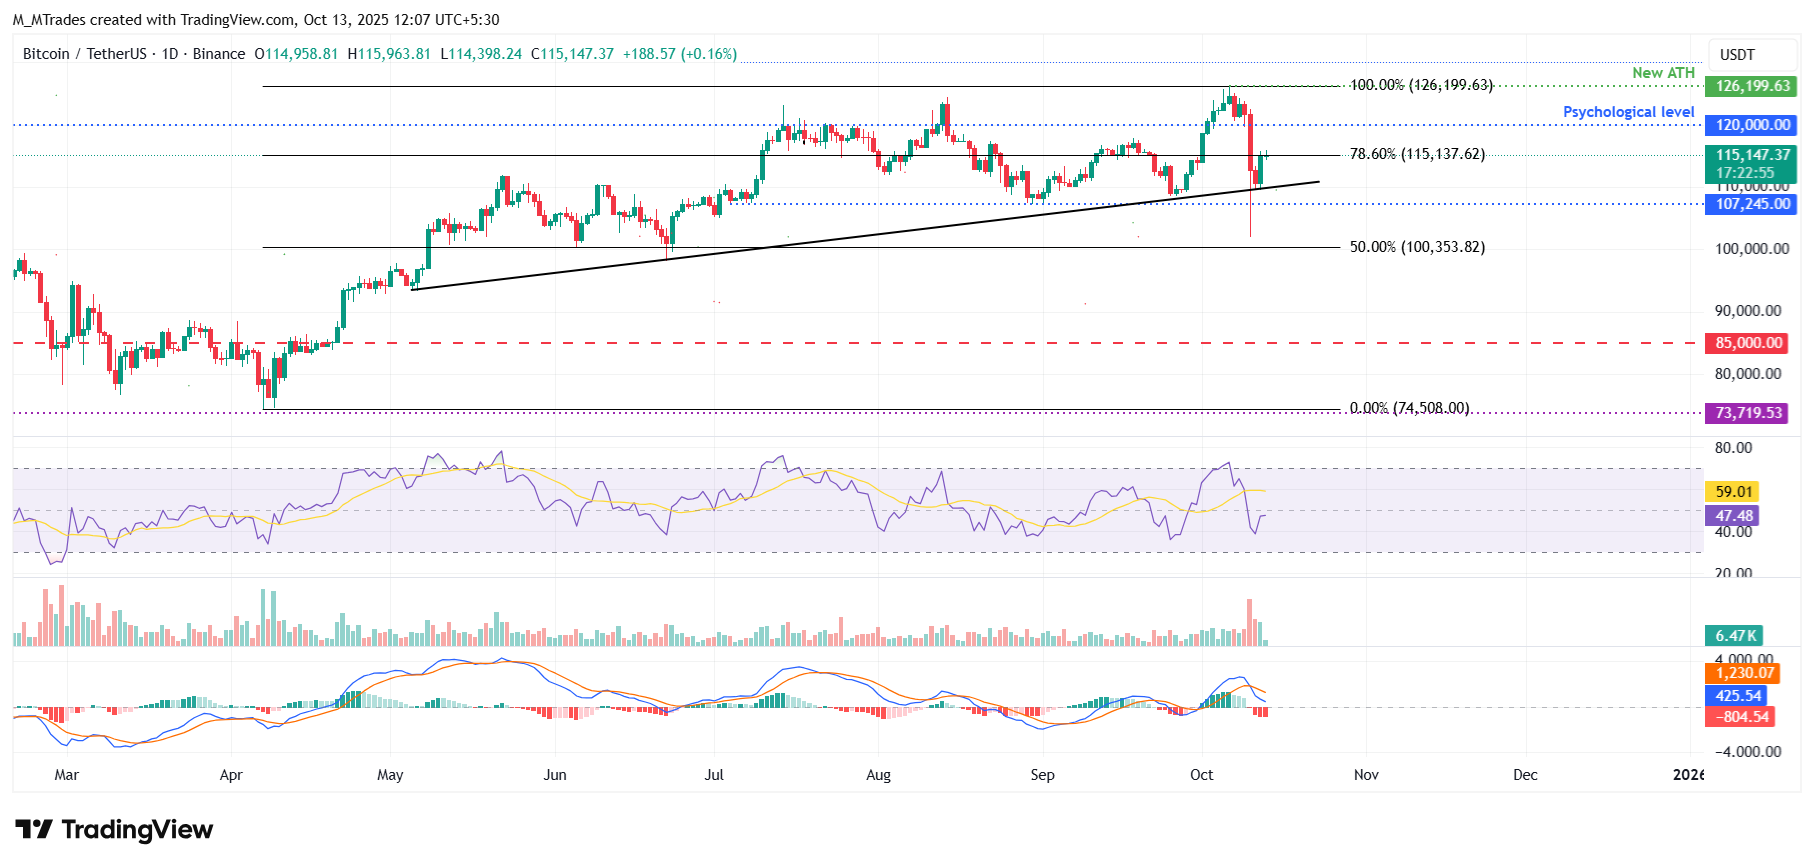
BTC/USDT daily chart
If BTC faces a correction, it could extend the decline toward the daily support at $107,245.
Read more
* The content presented above, whether from a third party or not, is considered as general advice only. This article should not be construed as containing investment advice, investment recommendations, an offer of or solicitation for any transactions in financial instruments.


