


Bitcoin Price Forecast: BTC jumps above $97K on optimism over US-China trade talks

- Bitcoin Drops to $70,000. U.S. Government Refuses to Bail Out Market, End of Bull Market or Golden Pit?
- Gold rallies further beyond $5,050 amid flight to safety, dovish Fed expectations
- Bitcoin Bottom Debate: $70,000 or $50,000?
- Bitcoin Slips Below 75,000 Mark. Will Strategy Change Its Mind and Sell?
- Bitcoin Rout. Bridgewater Founder Dalio Publicly Backs Gold.
- Ethereum Price Forecast: ETH faces heavy distribution as price slips below average cost basis of investors

Bitcoin price hovers around $97,000 on Wednesday after rebounding 2.7% in the last two days.
US and Chinese officials are set to start talks this weekend to de-escalate a trade war between the world’s two biggest economies.
The Fed interest rate decision in the American session could bring volatility for risky assets like BTC.
Bitcoin (BTC) price stabilizes at around $97,000 at the time of writing on Wednesday after rebounding 2.7% in the last two days. The crypto markets show optimism as US and Chinese officials are set to start talks this weekend to de-escalate the trade war. However, traders should be cautious as the US Federal Reserve (Fed) interest rate decision in the American session could bring volatility for risky assets like BTC.
Bitcoin recovers as US-China trade talks escalate
According to a BBC report on Wednesday, the world’s two biggest economies, the US and China, are set to start talks this week to try to de-escalate a trade war. High-level trade talks between the two countries will begin in Switzerland on Friday. Chinese Vice Premier He Lifeng and US officials Scott Bessent and Jamieson Greer will lead the discussions.
The report explains that the talks follow steep tariffs from both sides – up to 145% by the US and 125% by China. While the negotiations mark the first major diplomatic engagement since US President Donald Trump’s return to the Oval Office, experts caution that any resolution will likely take months. The crypto markets responded positively to news of the talks, as Bitcoin reclaimed the $97,000 mark following a slight pullback during the weekend.
Bitcoin could face volatility amid Fed interest rate decision
A K33 Research report on Tuesday says, “FOMC is rigged to cause significant volatility this week.”
The report explains that since the last Federal Open Market Committee (FOMC) meeting, US President Trump has attempted to pressure Fed Chair Jerome Powell into emergency rate cuts. Despite this pressure, broad market consensus points toward unchanged rates, maintaining the current target at 4.25% to 4.5% as the Fed maintains a wait-and-see strategy against the backdrop of tariff-induced uncertainty in the market.
Moreover, the BTC’s 7-day volatility reached a 563-day low on April 30. As shown in the graph below, the BTC-USD 7-day volatility recovers and stands at around 1.3%, indicating price fluctuations remain abnormally soft, and short-term volatility is abnormally compressed.
Such low volatility regimes in BTC tend to be short-lived. Traders should be cautious as violent volatility outbursts generally follow this form of stability once prices start to move, as leveraged trades are unwound and traders are reactivated into the market. This week’s FOMC meeting could act as a catalyst for this volatility bust.
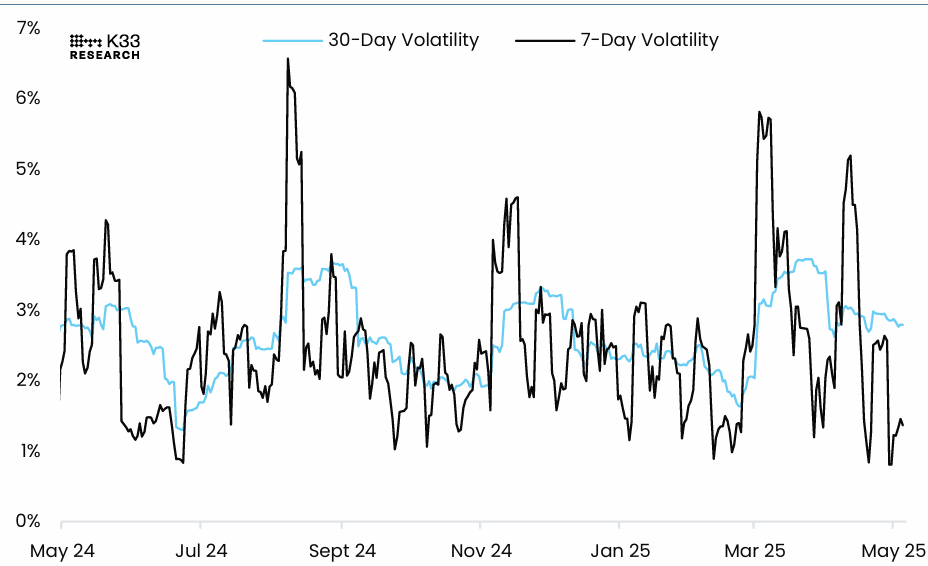
BTC/USD 7-day volatility chart. Source: K33 Research
New Hampshire becomes the first US state to establish a strategic Bitcoin reserve
New Hampshire Governor Kelly Ayotte signed House Bill 302 (HB 302) into law on Tuesday, making the state the first in the US to establish a Strategic Bitcoin Reserve. The law allows the state treasurer to invest up to 5% of public funds in Bitcoin and other digital assets. Bitcoin reacted positively to this news and rose 2.22%, closing around $96,800 that day.
The approval of the New Hampshire BTC reserve bill could set a precedent for other states, such as North Carolina, Texas, and Arizona, which are also listed in the State Reserve Race. This could be positive for Bitcoin in the long term and for its broader adoption.
Bitcoin Price Forecast: Rally toward $100,000 or correction to $90,000
Bitcoin price was rejected from its daily resistance level of $97,000 on Friday and declined 2.89% over the weekend. However, at the start of this week, it recovered from its pullback and continued rising through Tuesday. At the time of writing on Wednesday, it is approaching its key resistance level at $97,700.
If BTC breaks and closes above the $97,700 level on a daily basis, it could extend the rally toward its psychological resistance at $100,000.
However, if BTC faces resistance around $97,700 and corrects lower, it could extend the decline to retest its next key support level at $90,000.
The Relative Strength Index (RSI) on the daily chart reads 65, above its neutral level of 50, indicating a bullish momentum and supporting the bullish case. However, the Moving Average Convergence Divergence (MACD) indicator on the daily chart coils against each other, suggesting indecisiveness among traders.
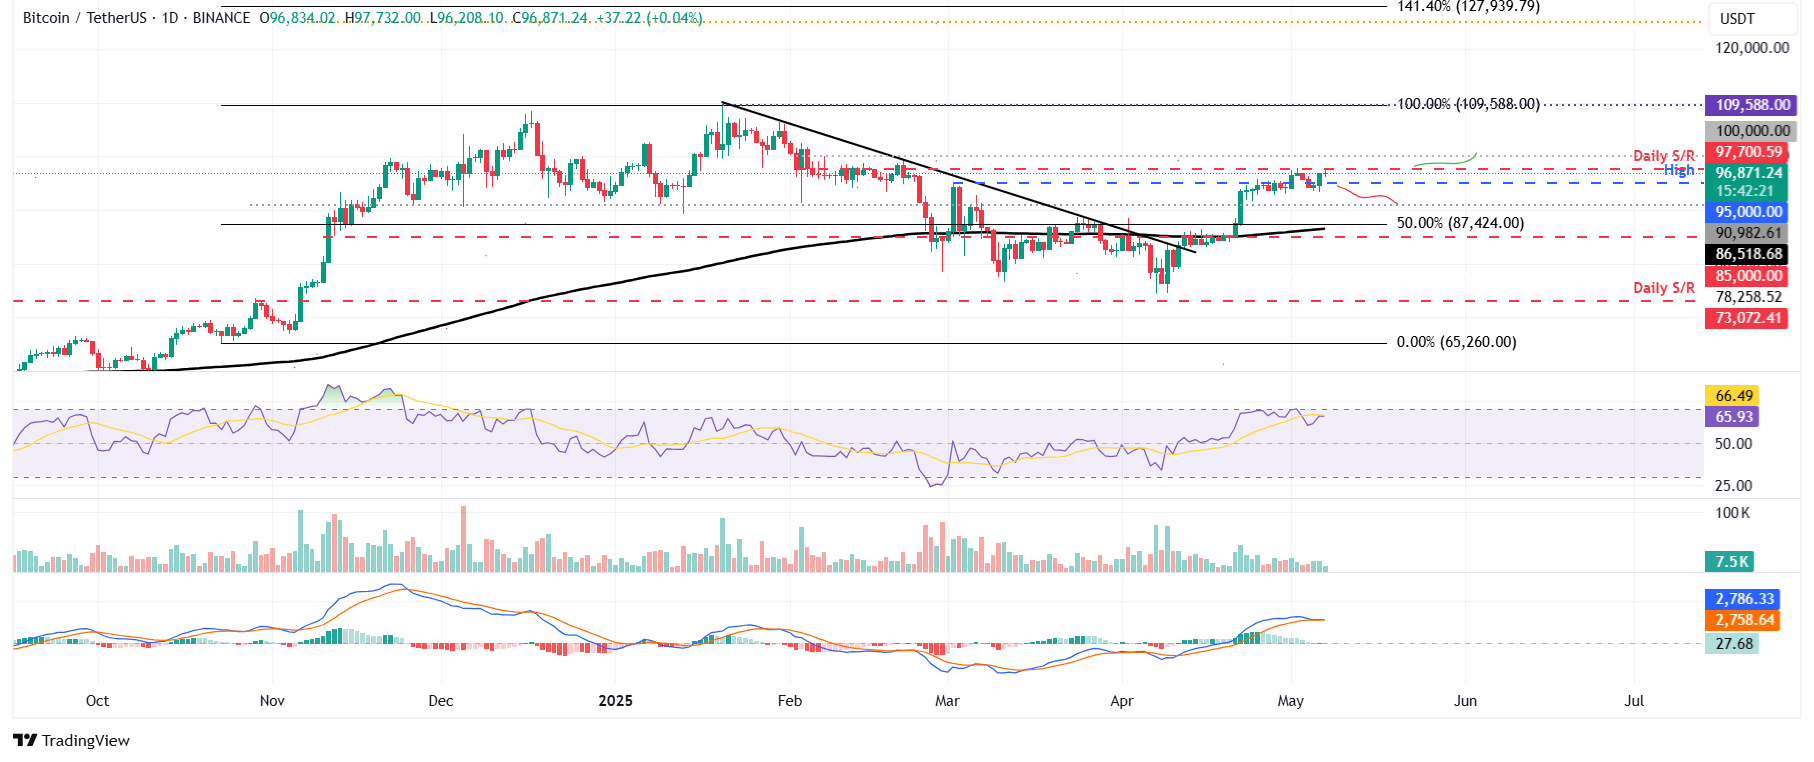
BTC/USDT daily chart
Read more
* The content presented above, whether from a third party or not, is considered as general advice only. This article should not be construed as containing investment advice, investment recommendations, an offer of or solicitation for any transactions in financial instruments.


