

Top 3 Price Prediction Bitcoin, Ethereum, Ripple: BTC and ETH show weakness while XRP remains strong

- Gold Price Forecast: US Non-Farm Payrolls Miss Expectations, Gold Surges Over $100, Can the Bull Run Continue?
- Gold Price Forecast: XAU/USD struggles to extend recovery above 20-day EMA
- Gold gains momentum above $4,100 after weak US NFP data
- TradingKey Daily Market Briefing: OPEC+ Continues Output Boost, Oil Prices Under Pressure, Gold Rebounds, Bitcoin Stands Above $63,000
- June Non-Farm Payrolls Preview: Did White House Economic Advisor Give an Early Hint? How Will US Stocks, Dollar and Gold React?
- Japanese Yen declines towards 162.00 vs USD as carry trades counter intervention risks

Bitcoin price continues to edge down around $94,100 on Monday after declining almost 4% last week.
Ethereum price approaches its key support level of $3,207; a firm close below it would continue its pullback.
Ripple price broke above its upper symmetrical triangle boundary, suggesting a rally ahead.
Bitcoin (BTC) and Ethereum (ETH) prices continue to trade in red on Monday after declining more than 3% and 10% in the previous week. However, Ripple (XRP) remains strong and breaks above its upper symmetrical triangle boundary, suggesting a rally ahead.
Bitcoin bulls show signs of weakness
Bitcoin price failed to sustain above the $100K mark on January 7 and declined 9.47% till Thursday. However, on Friday, it bounced 2.35% from its 38.20% Fibonacci retracement level at $92,493(drawn from the November 4 low of $66,835 to the December 17 high of $108,353) and hovered around the $94,500 level in the next two days. At the time of writing on Monday, it trades slightly down around $94,100.
BTC continues its correction and closes below $92,493; it could extend the decline to test the psychological level of $90,000.
The Relative Strength Index on the daily chart read 45, below its neutral level of 50, indicating bearish momentum. The Moving Average Convergence Divergence (MACD) indicator also shows a bearish crossover on Wednesday, suggesting a sell signal and a downtrend.
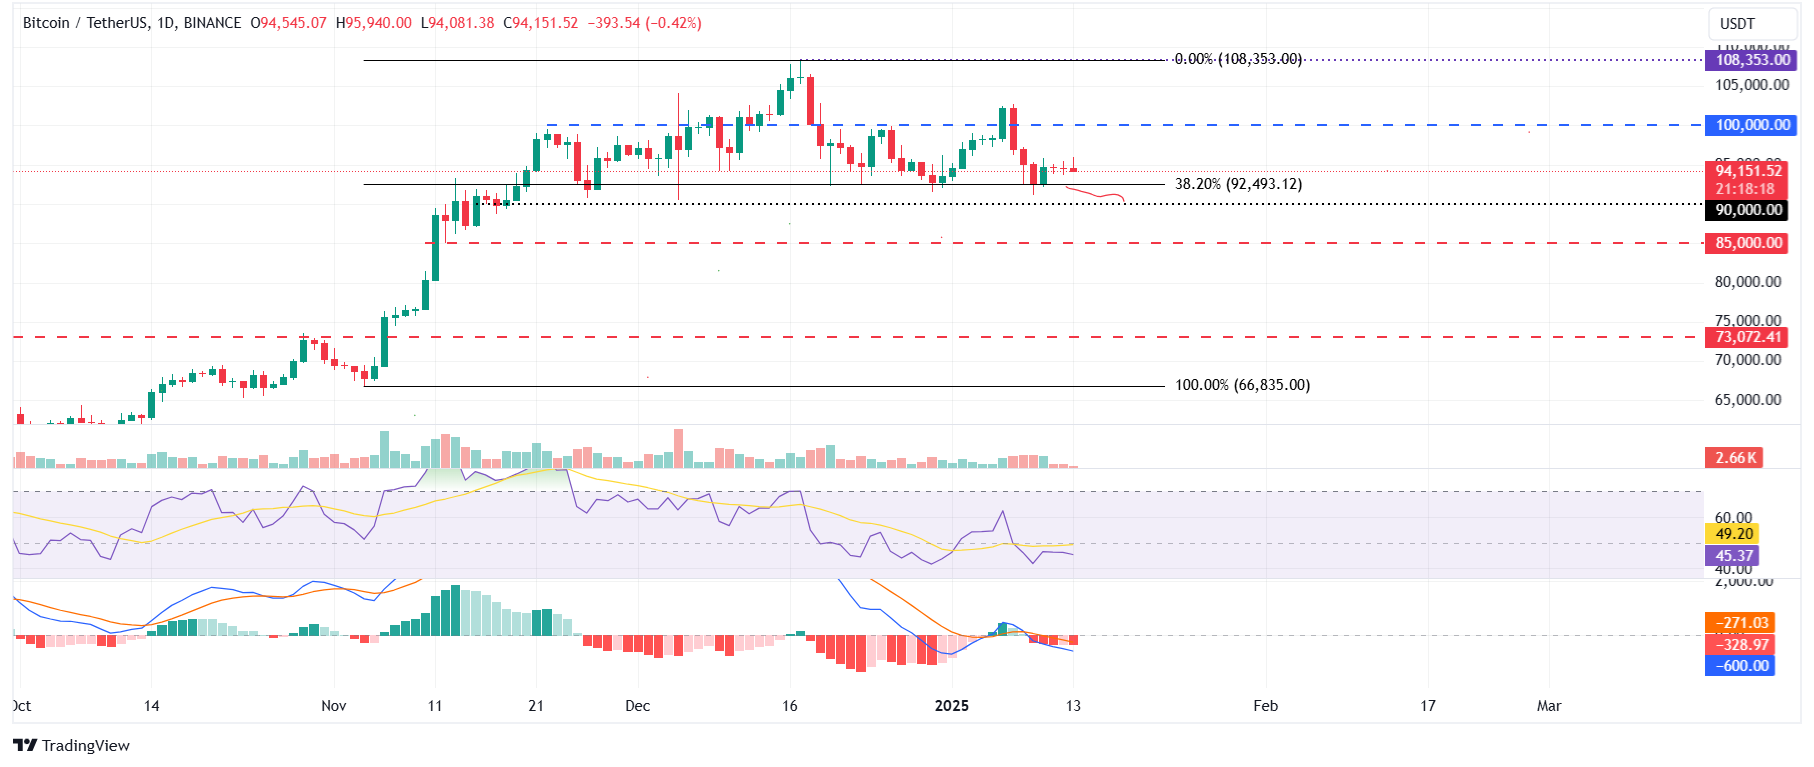
BTC/USDT daily chart
Conversely, if BTC recovers and closes above the $100,000 level, it could extend the rally to retest the December 17, 2024, all-time high of $108,353.
Ethereum could continue its correction if it closes below the $3,207 level
Ethereum price declined more than 10% last week after failing to close above the daily resistance of $3,730. As of Monday’s start of this week, it edges down, trading around $3,257, approaching its key support level of around $3,207.
If ETH closes below the $3,207 support level, it could extend the decline to test its psychological importance level of $3,000.
The RSI indicator on the daily chart reads 40, below its neutral level of 50, indicating bearish momentum. The MACD indicator also shows a bearish crossover on Thursday, suggesting a sell signal and a downtrend.
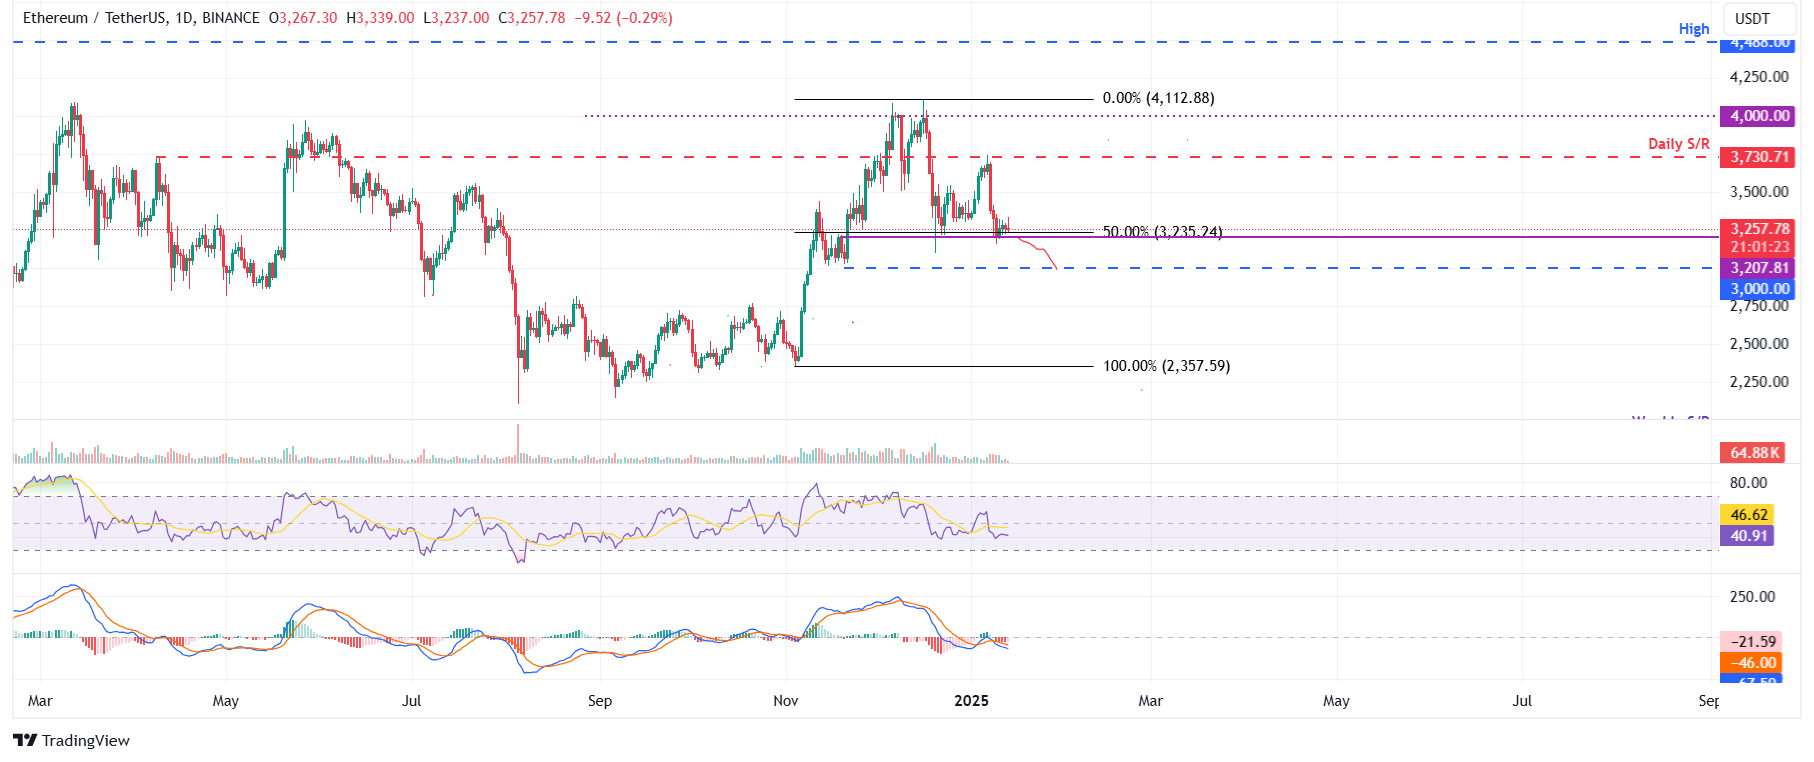
ETH/USDT daily chart
On the other hand, if ETH recovers, it could extend the rally to retest its daily resistance at $3,730.
Ripple price is poised for a rally as it breaks above the symmetrical triangle pattern
Ripple price broke above its symmetrical triangle on Saturday and rallied 10%. This technical pattern was formed by connecting multiple highs and lows with two converging trendlines (from early December to early January). This technical pattern has a bullish bias, and the target is generally obtained by measuring the distance between the first swing high and the first swing low to the breakout point. However, it faces rejection around its daily resistance level of $2.56 on Sunday. At the time of writing on Monday, it trades at around $2.51.
If XRP closes above the daily resistance level at $2.56, the technical target obtained by this pattern would be $3.63. Investors should be cautious of this theoretical move as it could face a slowdown after a 17% rally to retest Ripple’s psychological importance level of $3.00 as traders could opt to book profits.
The RSI indicator reads 59, above its neutral value of 50, indicating bullish momentum. Additionally, the MACD shows a bullish crossover on Sunday, suggesting an upward trend.
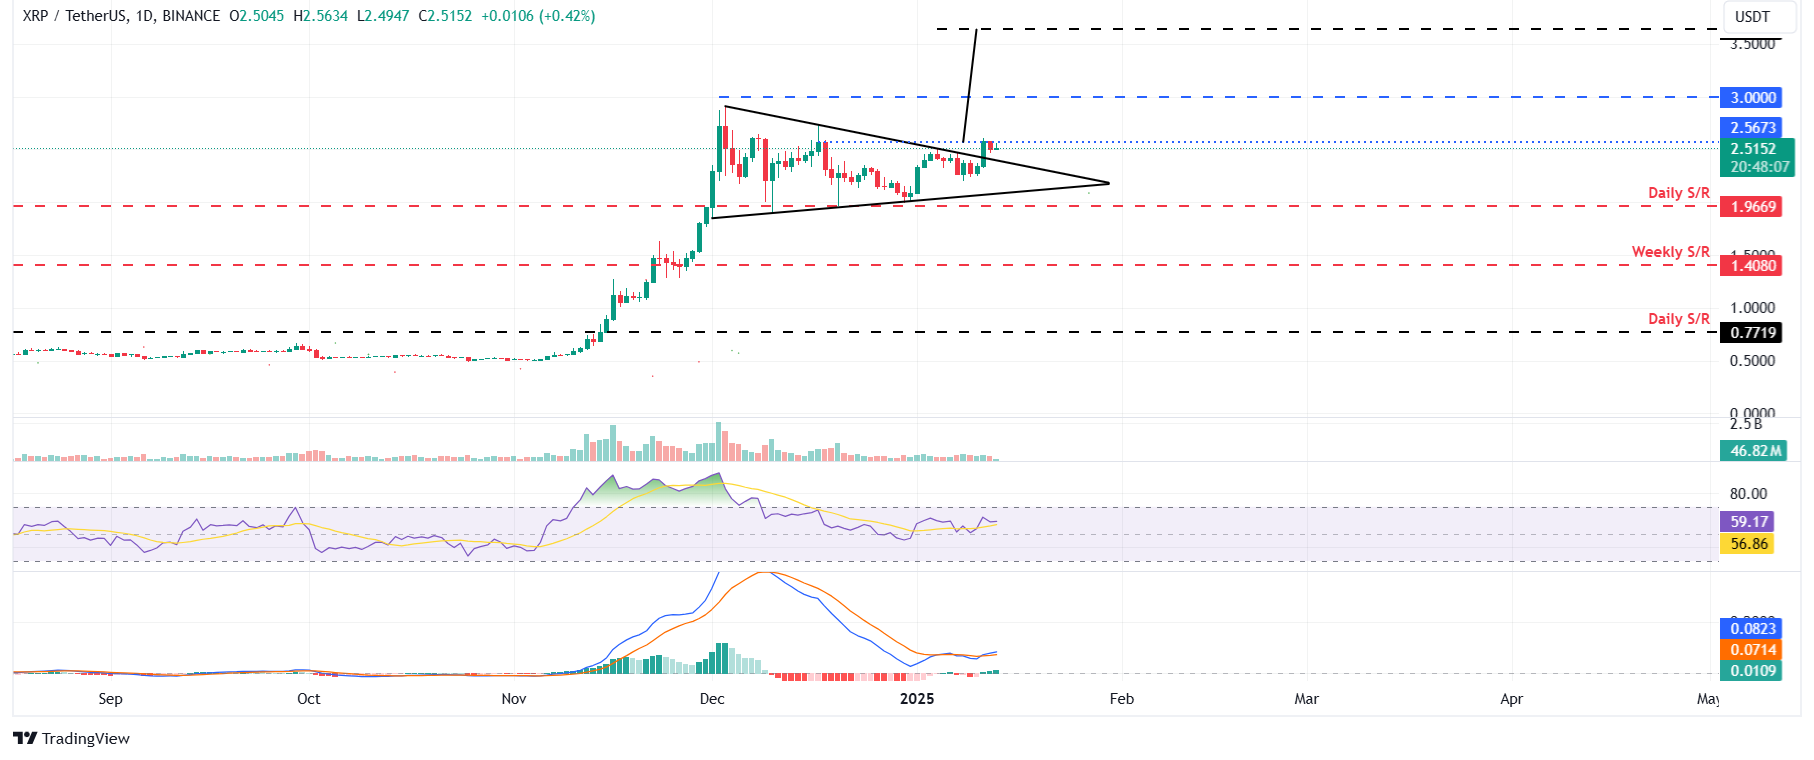
XRP/USDT daily chart
However, if XRP closes below the $1.96 daily support level, it would extend the decline to retest its next support level at $1.40.
Read more
* The content presented above, whether from a third party or not, is considered as general advice only. This article should not be construed as containing investment advice, investment recommendations, an offer of or solicitation for any transactions in financial instruments.


