Curve Attack Causes Steep Decline in CRV Price, Will it Trigger a Cryptocurrency Market Crash?

Trending Articles
coverImg
Source: DepositPhotos

Market review

Last week (7/24-7/30), the cryptocurrency market overall experienced a downturn, with total market capitalization and market sentiment index continuing to decline.


The total market capitalization followed the previous trend and plunged from $1.2 trillion to $1.17 trillion, a 3% decrease. Currently, there has been a slight rebound in total market capitalization, reaching $1.8 trillion.


The market sentiment index hit a new low for July, dropping to a minimum of 51, approaching the neutral value of 50. There are currently no signs of improved market sentiment, gradually entering a subdued state, and the probability of falling below the neutral level in the near future is high.


Cryptocurrency Market Capitalization (yellow) and Fear Greed Index (blue) trend from 2023.1.1 to 2023.7.30; Source: MacroMicro.


Mainstream coins showed relative resilience last week, with equal parts of oscillation and upward movement. Uniswap (UNI) performed the best, rising by 11%, followed by Stellar (XLM) with a 7% increase. On the other hand, Polkadot (DOT) and Chainlink (LINK) performed the worst, although their declines did not exceed 1%.


Bitcoin (BTC) and Ethereum (ETH) prices remained relatively unchanged, oscillating within a narrow range with increases of less than 1%. Their respective market dominance also saw little change, at 48.2% and 19.1%.

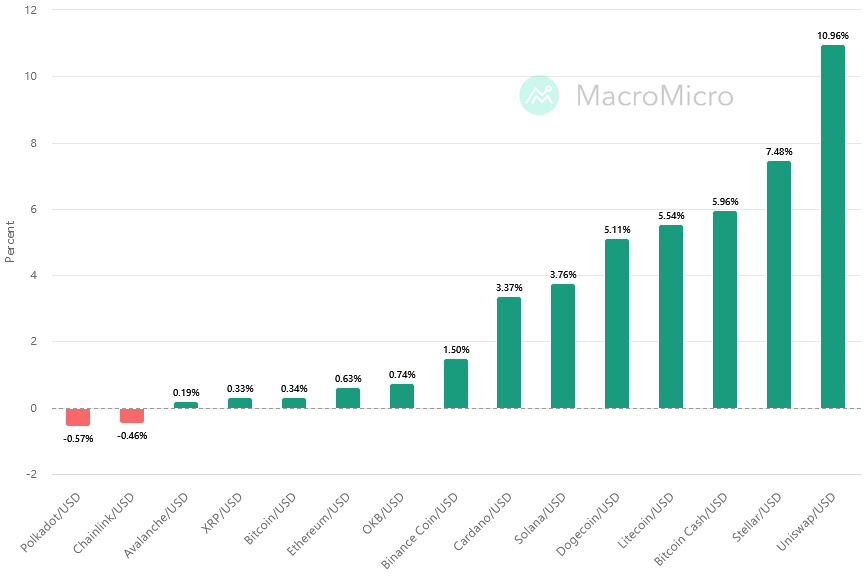
Performance of mainstream coins from 7/24 to 7/30; Source: MacroMicro.


Multiple stablecoin pools on Curve attacked, CRV drops over 20% in 24 hours.

On July 31st, Curve Finance tweeted that their stablecoin pools (alETH/msETH/pETH) using the Ethereum programming language Vyper 0.2.15 had been attacked, while other pools remained secure. The team is currently evaluating the impact and will provide timely updates on the situation.


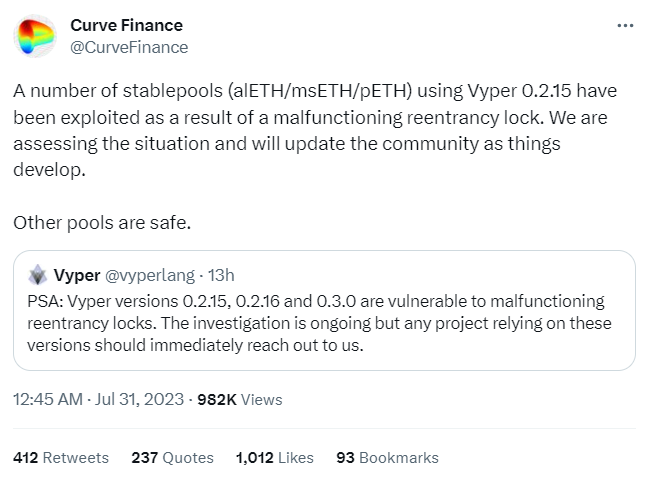
Official announcement by Curve Finance, Source: X.


Due to the attack, Curve Finance's Total Value Locked (TVL) was significantly affected, plummeting from $3.3 billion on July 30th to $1.7 billion, representing a loss of $1.6 billion and a 48% decline within 24 hours.


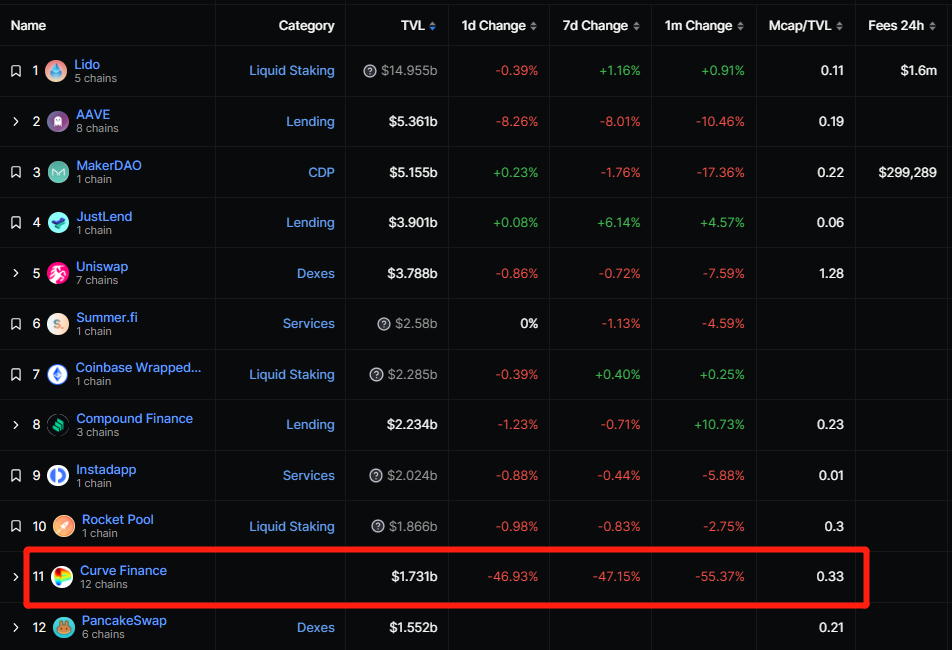
Curve Finance TVL change and ranking, Source: DefiLlama.


Meanwhile, major exchanges such as Binance, OKEx, and Bithumb displayed risk warnings on their trading pages, cautioning users about the high volatility of the CRV token and advising them to trade carefully and be aware of the risks. Some exchanges even temporarily suspended CRV deposits and withdrawals, such as Upbit.


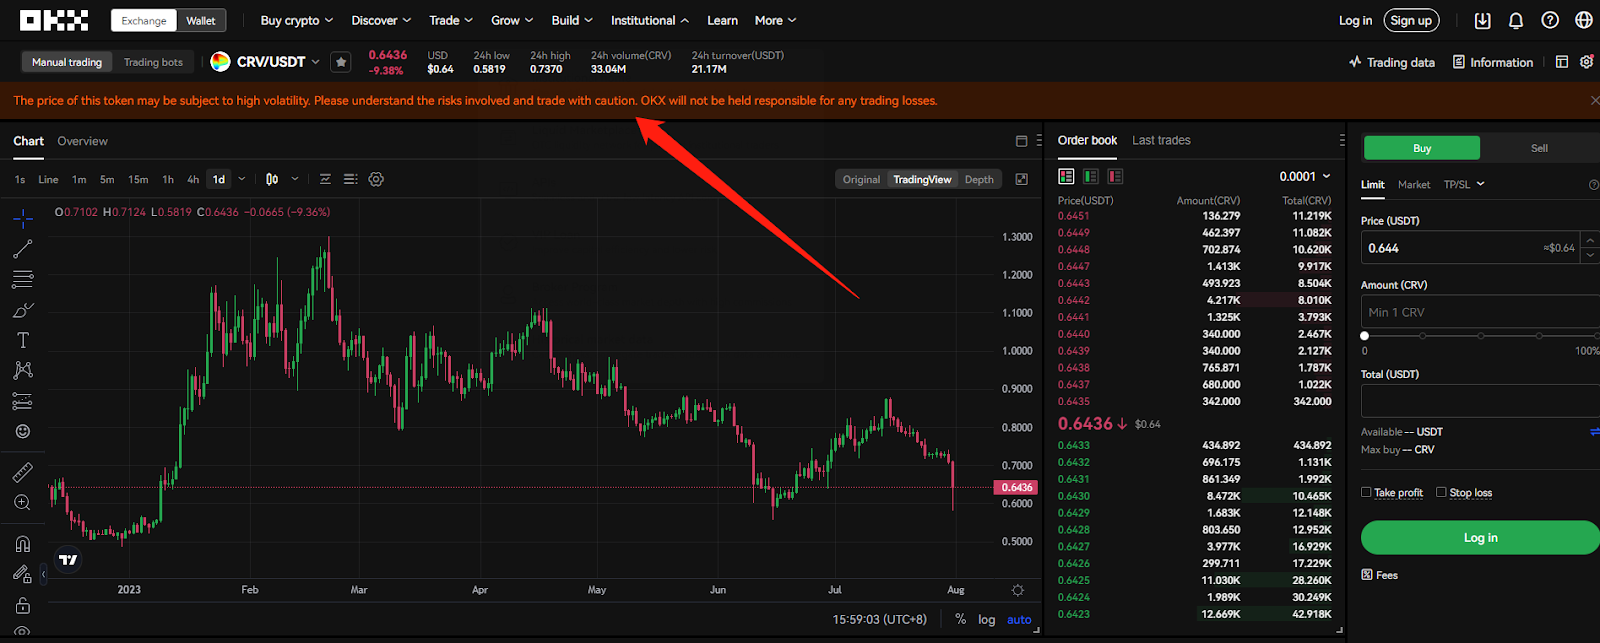
Risk warning messages regarding CRV, Source: OKEx.


In response to the negative news, the price of CRV experienced a sharp decline, dropping from a low of $0.73 to $0.58, a decrease of over 20%. At the time of writing, CRV has rebounded slightly and is priced at $0.65. While most of the market is bearish on CRV, there are also individuals who see it as a buying opportunity. Wu Jihan, co-founder of Bitmain, and current chairman of Bitdeer, expressed on social media that he has bought CRV at its lowest point.


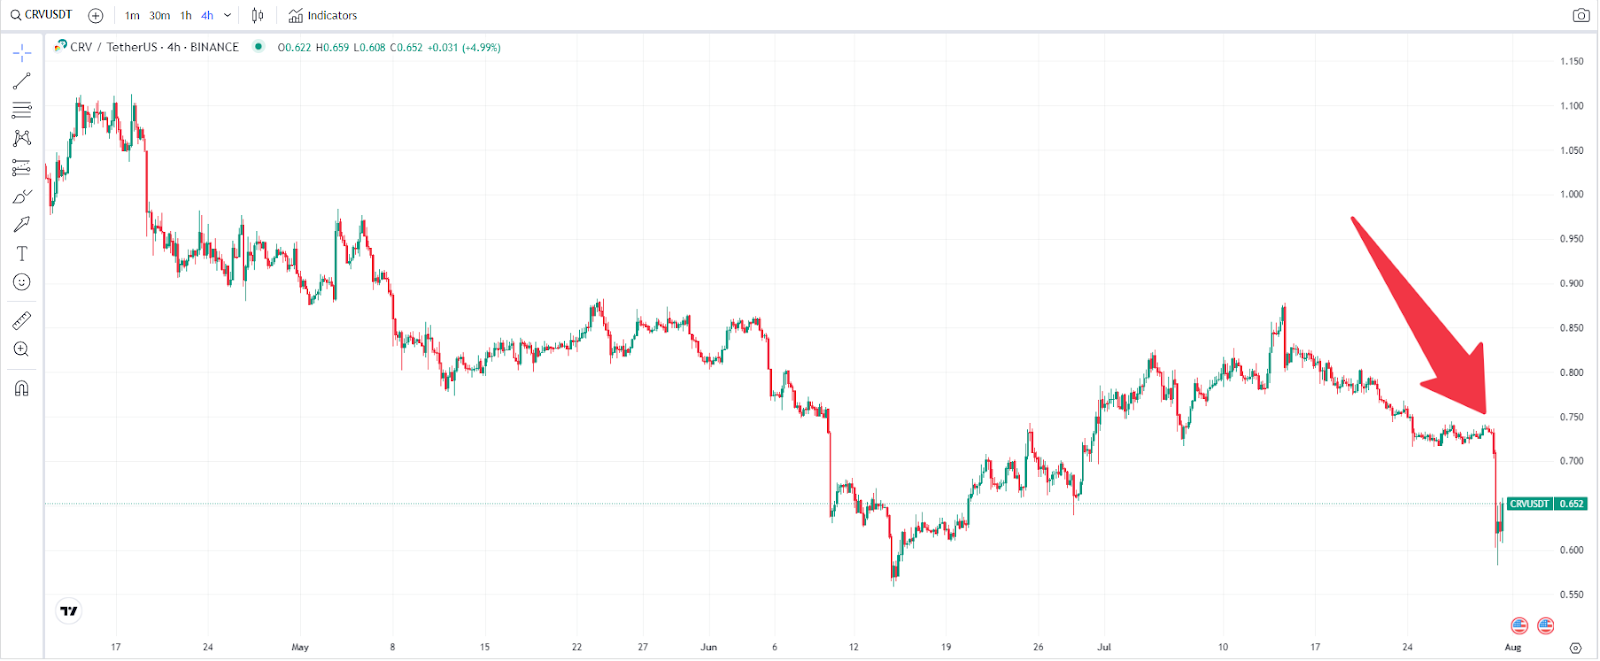
CRV price chart over 4 hours, Source: TradingView.


Will the Curve incident trigger a cryptocurrency market crash?

Although the Curve Finance incident was caused by an attack, the fundamental issue lies in the presence of bugs in the Vyper programming language used for writing smart contracts, leading to project vulnerabilities. This means that projects using Vyper are exposed to higher risks.


Regarding the direct economic losses caused by this attack, monitoring data from PeckShield, a top global blockchain security company, shows that it has resulted in $52 million in losses so far, involving multiple decentralized finance (DeFi) projects, including Alchemix (DeFi lending), JPEGd (NFT lending), Metronome DAO (synthetic assets), deBridge (cross-chain), EIIipsis (DEX), and others.


Furthermore, there is a possibility of CRV liquidations. According to data, Curve founder Egorov has collateralized over 292 million CRV tokens on platforms such as AAVE, Fraxlend, Abracadabr, Inverse, with a liquidation price of $0.4. What does this mean exactly?


If investors further sell off CRV, causing it to drop to $0.4, Egorov's 292 million CRV tokens (which account for 33% of the circulating supply) would be forcefully sold by the platforms due to insufficient collateralization. This would inevitably trigger another devastating crash.


In addition to CRV itself, attention should be given to other projects using Vyper, especially the Vyper 0.2.15 version, as they may also have similar issues that have yet to be discovered. If these issues occur on a large scale, this incident could become a bearish tool influencing the entire cryptocurrency market, seizing the opportunity to drive a market pullback.

Bitcoin: Breaks Support and Hits July Low, What's the Outlook for BTC in the Second Half of 2023?

On July 24th, BTC fell below $30,000, hitting a low of $28,863, marking a new low for July. Since then, Bitcoin has been oscillating in a narrow range, with daily fluctuations of around 1%, which has lasted for a week.


Bitcoin price trend from July 2022 to July 2023, Source: TradingView.


Although Bitcoin did not experience a decline due to the CRV incident, its price trend is not optimistic. The rebound highs have been consistently lower, while the pullback lows continue to set new records, indicating a downward channel.


Moving forward, without significant positive catalysts, Bitcoin will be controlled by bearish sentiment, transitioning from a previous tug-of-war scenario to accelerated selling pressure. Therefore, it is expected that BTC will experience an accelerated pullback in the second half of the year, potentially testing the $25,000 level.


BTC/USD daily chart, Source: TradingView.


Read more

  • Gold remains bid as lack of Fed clarity and geopolitical frictions persist
  • Ethereum Price Slips Lower — $3,000 Looms as the Key Battleground
  • Note: If you want to share the article 《Curve Attack Causes Steep Decline in CRV Price, Will it Trigger a Cryptocurrency Market Crash?》, make sure you retain the original link. For more information, please visit Insights or browse www.mitrade.com.

    * The content presented above, whether from a third party or not, is considered as general advice only.  This article should not be construed as containing investment advice, investment recommendations, an offer of or solicitation for any transactions in financial instruments.

    goTop
    quote
    Related Articles
    placeholder
    U.S. November Nonfarm Payrolls: What Does the Rare "Weak Jobs, Strong Economy" Mix Mean for U.S. Equities?1. IntroductionAfter retreating from the late-October highs, U.S. equities embarked on a bottoming rebound in mid-to-late November, a trend driven by the interplay of multiple factors. That said, it i
    Author  TradingKey
    10 hours ago
    1. IntroductionAfter retreating from the late-October highs, U.S. equities embarked on a bottoming rebound in mid-to-late November, a trend driven by the interplay of multiple factors. That said, it i
    placeholder
    Senate Delays Crypto Market Structure Hearings to Early 2026The Senate Banking Committee has postponed cryptocurrency market structure hearings until 2026, citing ongoing bipartisan negotiations.
    Author  Mitrade
    14 hours ago
    The Senate Banking Committee has postponed cryptocurrency market structure hearings until 2026, citing ongoing bipartisan negotiations.
    placeholder
    Bitcoin Slides 5% as Sellers Lean In — Can BTC Reclaim $88,000?Bitcoin has dropped back below $88,000 after rolling over from $90,500, with price still trading under the 100-hour Simple Moving Average. The sell-off found a floor at $85,151, and BTC is now consolidating near that base, but rebounds are facing pressure from a bearish trend line around $89,000. Bulls need to retake $88,000–$89,000 to ease downside risk; failure to do so keeps $85,500–$85,000 and then $83,500 in play, with $80,000 as the deeper “line in the sand.” Bitcoin (BTC) is back in damage-control mode after a sharp pullback wiped out recent gains. The price failed to reclaim the $90,000–$90,500 band, rolled over, and slid through $88,500 before briefly dipping under $87,000. Buyers did show up around $85,000, but the rebound so far looks more like stabilization than a clear trend reversal. Bitcoin dips hard, finds a bid near $85,000(h3) BTC’s latest move lower began when it couldn’t build follow-through above $90,000 and $90,500. Once that upside stalled, sellers took control and pushed price down through $88,500. The slide accelerated enough to spike below $87,000, but the market didn’t free-fall. Bulls defended the $85,000 zone, printing a low at $85,151. Since then, Bitcoin has been consolidating below the 23.6% Fibonacci retracement of the drop from the $93,560 swing high to the $85,151 low — a clue that the bounce is still shallow and that sellers haven’t fully backed off yet. Structurally, BTC is still on the back foot: It’s trading below $88,000, and It remains below the 100-hour Simple Moving Average, keeping short-term trend pressure pointed downward. Resistance is layered, and $89,000 is the problem area(h3) If bulls try to turn this into a recovery, they’ll have to climb through multiple ceilings in quick succession. First, BTC faces resistance around $87,150, followed by a more meaningful barrier near $87,500. From there, the market’s attention snaps back to $88,000 — the level BTC just lost and now needs to reclaim. A close back above $88,000 would improve the tone, but it doesn’t solve the bigger issue: there’s a bearish trend line on the hourly BTC/USD chart (Kraken feed) with resistance near $89,000, which also lines up with the next technical hurdle. If BTC can push through $89,000 and hold, the rebound could extend toward $90,000, with follow-through targets at $91,000 and $91,500. But until price clears that $88,000–$89,000 zone, rallies are at risk of being sold rather than chased. If BTC fails to reclaim resistance, the downside path is clear(h3) The near-term bear case is simple: if Bitcoin can’t climb back above the $87,000 area and keep traction, sellers may attempt another leg lower. Support levels line up like this: Immediate support: $85,500 First major support: $85,000 Next support: $83,500 Then $82,500 in the near term Below that, the major “don’t break this” level is still $80,000. If BTC slips under $80,000, the risk of acceleration to the downside increases significantly — not because it’s magic, but because it’s the kind of psychological and structural level that tends to trigger forced de-risking. Indicators: momentum still leans bearish(h3) The intraday indicators aren’t offering much comfort yet: Hourly MACD is losing pace in the bearish zone. Hourly RSI remains below 50, suggesting sellers still have the upper hand on short timeframes. So while the $85,000 defense held for now, the market hasn’t flipped bullish — it’s just stopped bleeding.
    Author  Mitrade
    17 hours ago
    Bitcoin has dropped back below $88,000 after rolling over from $90,500, with price still trading under the 100-hour Simple Moving Average. The sell-off found a floor at $85,151, and BTC is now consolidating near that base, but rebounds are facing pressure from a bearish trend line around $89,000. Bulls need to retake $88,000–$89,000 to ease downside risk; failure to do so keeps $85,500–$85,000 and then $83,500 in play, with $80,000 as the deeper “line in the sand.” Bitcoin (BTC) is back in damage-control mode after a sharp pullback wiped out recent gains. The price failed to reclaim the $90,000–$90,500 band, rolled over, and slid through $88,500 before briefly dipping under $87,000. Buyers did show up around $85,000, but the rebound so far looks more like stabilization than a clear trend reversal. Bitcoin dips hard, finds a bid near $85,000(h3) BTC’s latest move lower began when it couldn’t build follow-through above $90,000 and $90,500. Once that upside stalled, sellers took control and pushed price down through $88,500. The slide accelerated enough to spike below $87,000, but the market didn’t free-fall. Bulls defended the $85,000 zone, printing a low at $85,151. Since then, Bitcoin has been consolidating below the 23.6% Fibonacci retracement of the drop from the $93,560 swing high to the $85,151 low — a clue that the bounce is still shallow and that sellers haven’t fully backed off yet. Structurally, BTC is still on the back foot: It’s trading below $88,000, and It remains below the 100-hour Simple Moving Average, keeping short-term trend pressure pointed downward. Resistance is layered, and $89,000 is the problem area(h3) If bulls try to turn this into a recovery, they’ll have to climb through multiple ceilings in quick succession. First, BTC faces resistance around $87,150, followed by a more meaningful barrier near $87,500. From there, the market’s attention snaps back to $88,000 — the level BTC just lost and now needs to reclaim. A close back above $88,000 would improve the tone, but it doesn’t solve the bigger issue: there’s a bearish trend line on the hourly BTC/USD chart (Kraken feed) with resistance near $89,000, which also lines up with the next technical hurdle. If BTC can push through $89,000 and hold, the rebound could extend toward $90,000, with follow-through targets at $91,000 and $91,500. But until price clears that $88,000–$89,000 zone, rallies are at risk of being sold rather than chased. If BTC fails to reclaim resistance, the downside path is clear(h3) The near-term bear case is simple: if Bitcoin can’t climb back above the $87,000 area and keep traction, sellers may attempt another leg lower. Support levels line up like this: Immediate support: $85,500 First major support: $85,000 Next support: $83,500 Then $82,500 in the near term Below that, the major “don’t break this” level is still $80,000. If BTC slips under $80,000, the risk of acceleration to the downside increases significantly — not because it’s magic, but because it’s the kind of psychological and structural level that tends to trigger forced de-risking. Indicators: momentum still leans bearish(h3) The intraday indicators aren’t offering much comfort yet: Hourly MACD is losing pace in the bearish zone. Hourly RSI remains below 50, suggesting sellers still have the upper hand on short timeframes. So while the $85,000 defense held for now, the market hasn’t flipped bullish — it’s just stopped bleeding.
    placeholder
    AUD/USD remains depressed below mid-0.6600s; downside seems limited ahead of US NFP reportThe AUD/USD pair attracts some sellers for the fourth straight day on Tuesday and trades around the 0.6630 region, down just over 0.10%, during the Asian session.
    Author  FXStreet
    18 hours ago
    The AUD/USD pair attracts some sellers for the fourth straight day on Tuesday and trades around the 0.6630 region, down just over 0.10%, during the Asian session.
    placeholder
    Macro Analysts: Hawkish Japan Could Push Bitcoin Below $70KAnalysts predict Bitcoin may face further declines towards the $70,000 mark if the Bank of Japan raises interest rates as expected.
    Author  Mitrade
    Yesterday 05: 48
    Analysts predict Bitcoin may face further declines towards the $70,000 mark if the Bank of Japan raises interest rates as expected.