Bitcoin Dominance at Risk as Altcoin Market Cap Targets $1.5 Trillion

Mitrade
coverImg
Source: DepositPhotos

In recent weeks, many altcoins have started to outperform Bitcoin (BTC). This has sparked speculation that the market could be inching toward the anticipated altcoin season. During this period, altcoins tend to deliver higher percentage gains compared to Bitcoin, drawing more investor interest and capital flow into these assets. 


While the recent price rallies in key altcoins could signal the early stages of this trend, this analysis examines whether technical patterns are following suit.


Bitcoin Steps Back, Altcoins Break Out of Falling Wedge


To validate the altcoin season, at least 75% of the top 100 cryptos must outperform the number one coin within 90 days. For the last six months, this has not happened because Bitcoin’s dominance ensured that altcoins played second fiddle to it.


However, according to Blockchaincenter, things are starting to change. The altcoin season index has moved from less than 18 some weeks back to 31. This increase could be connected to the performance of cryptos like Sui (SUI), Bittensor (TAO), Fantom (FTM), and a host of others. 
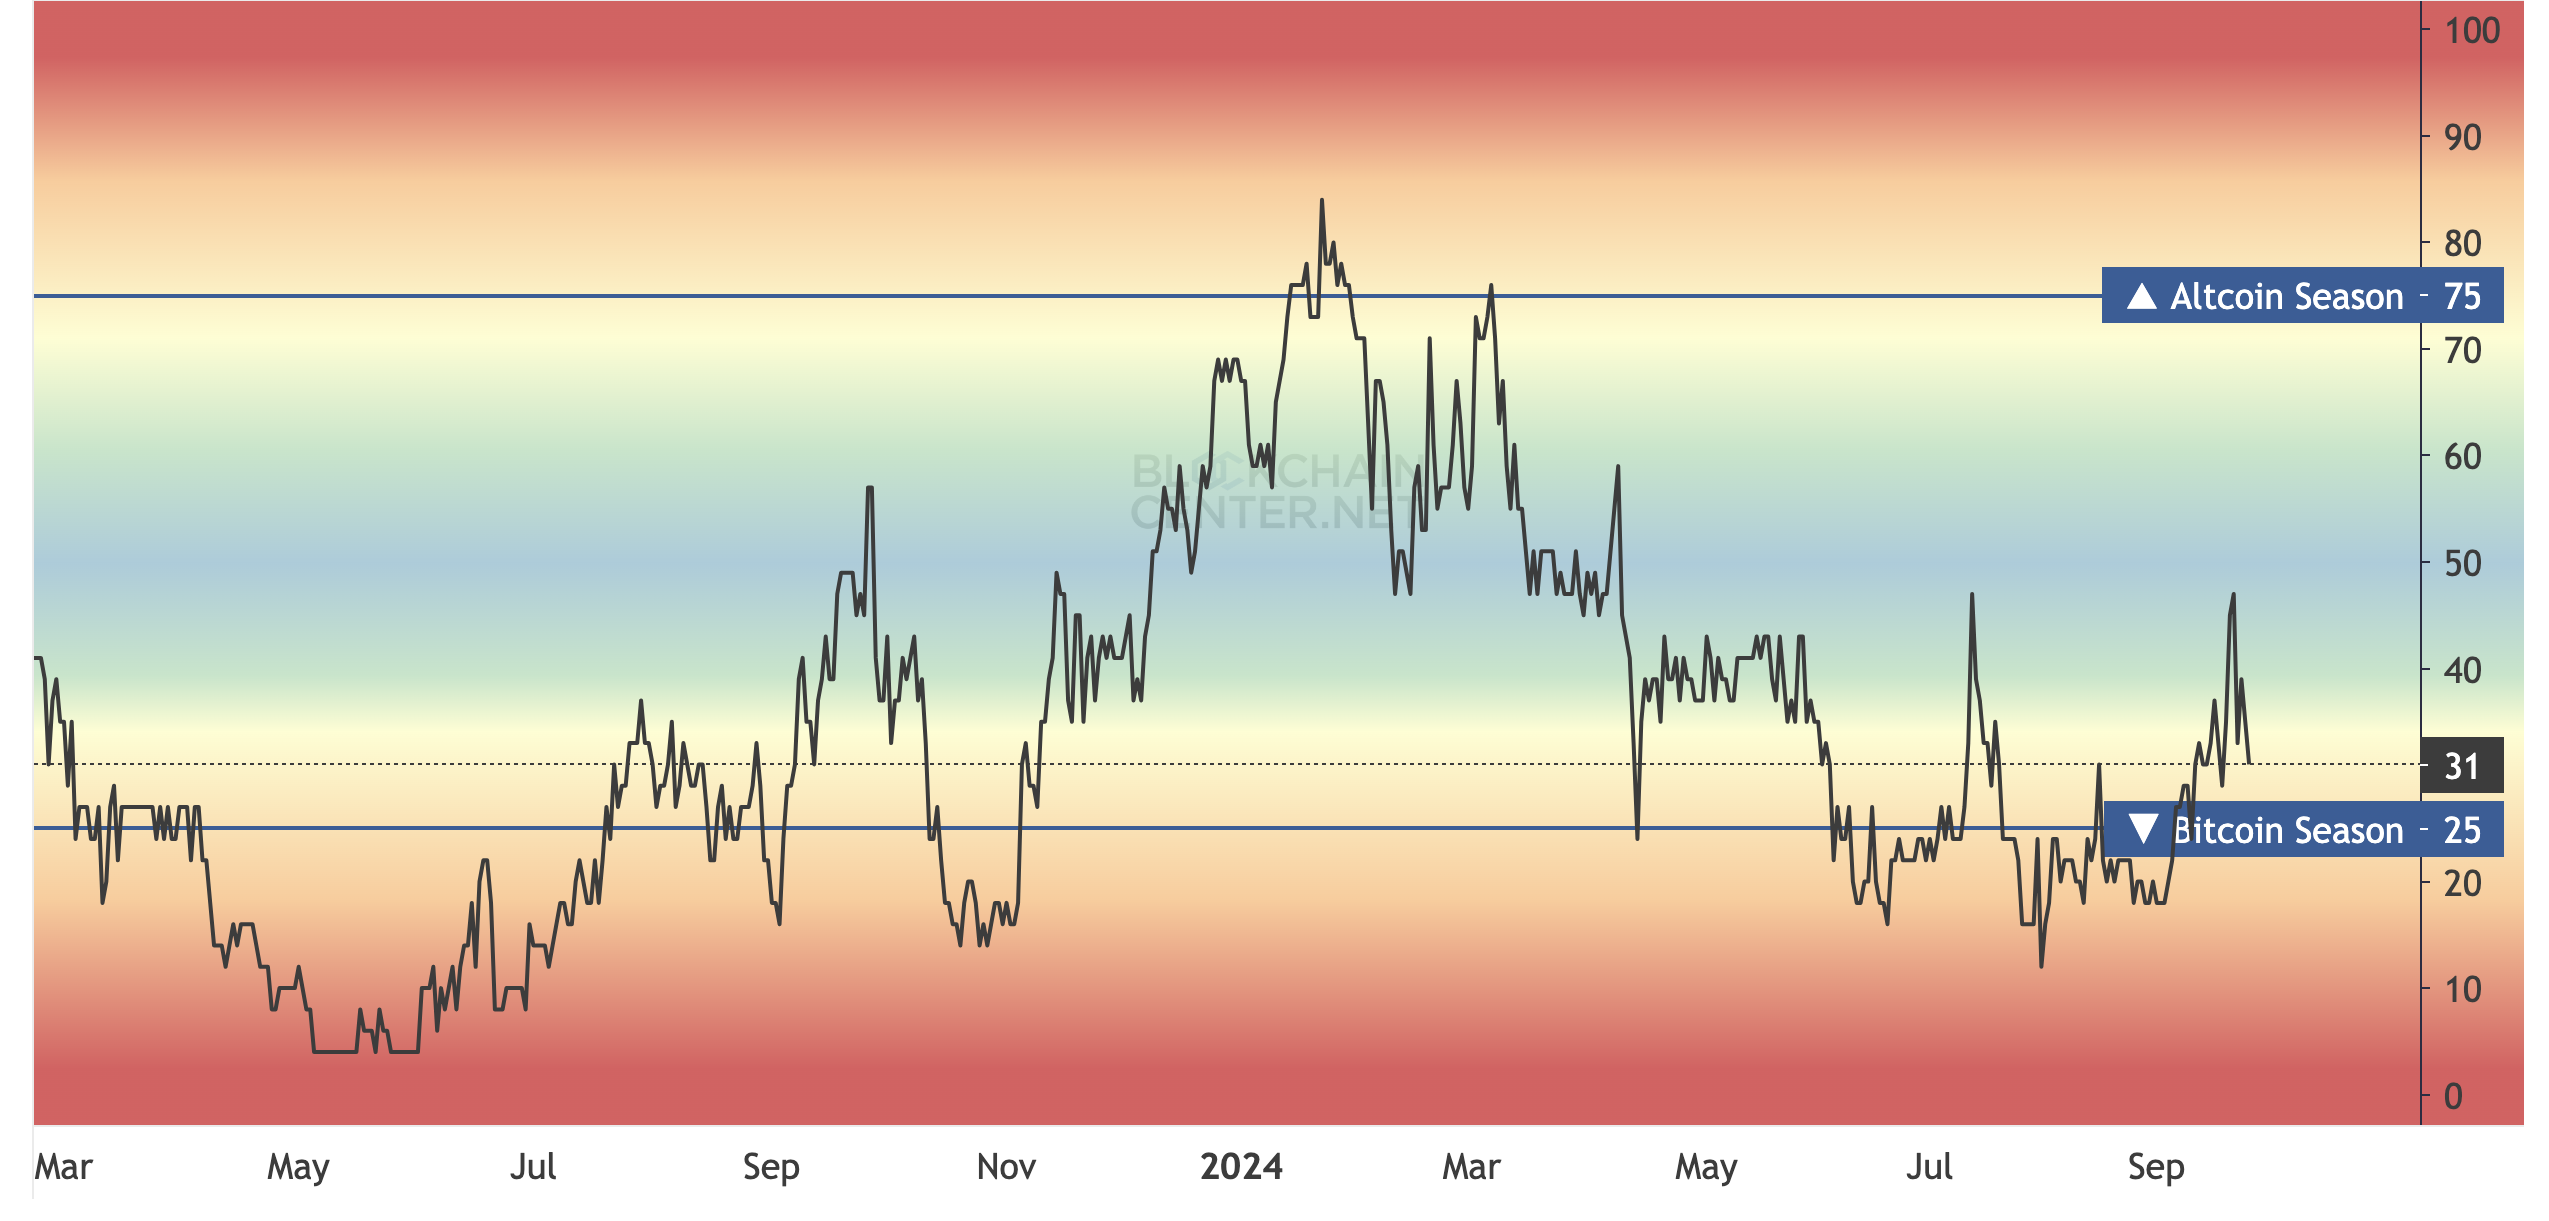
Altcoin Season Index. 
Altcoin Season Index. Source: Blockchaincenter


Despite the improvement, it is important to note that it is not yet altcoin season. However, based on the daily chart, Bitcoin Dominance (BTC.D) has decreased since September 19.


Furthermore, the TOTAL2 chart, which shows the total crypto market cap excluding BTC, has increased nearly 18% since September 7. This disparity in performance aligns with the notion that Bitcoin might soon step back and allow altcoins to take the lead.


Besides that, BeInCrypto noticed that the TOTAL2 had broken out of a falling wedge. For context, a falling wedge is seen as a bullish signal formed by two descending trendlines. One represents the highs, and the other the lows.


Read more: 10 Best Altcoin Exchanges In 2024
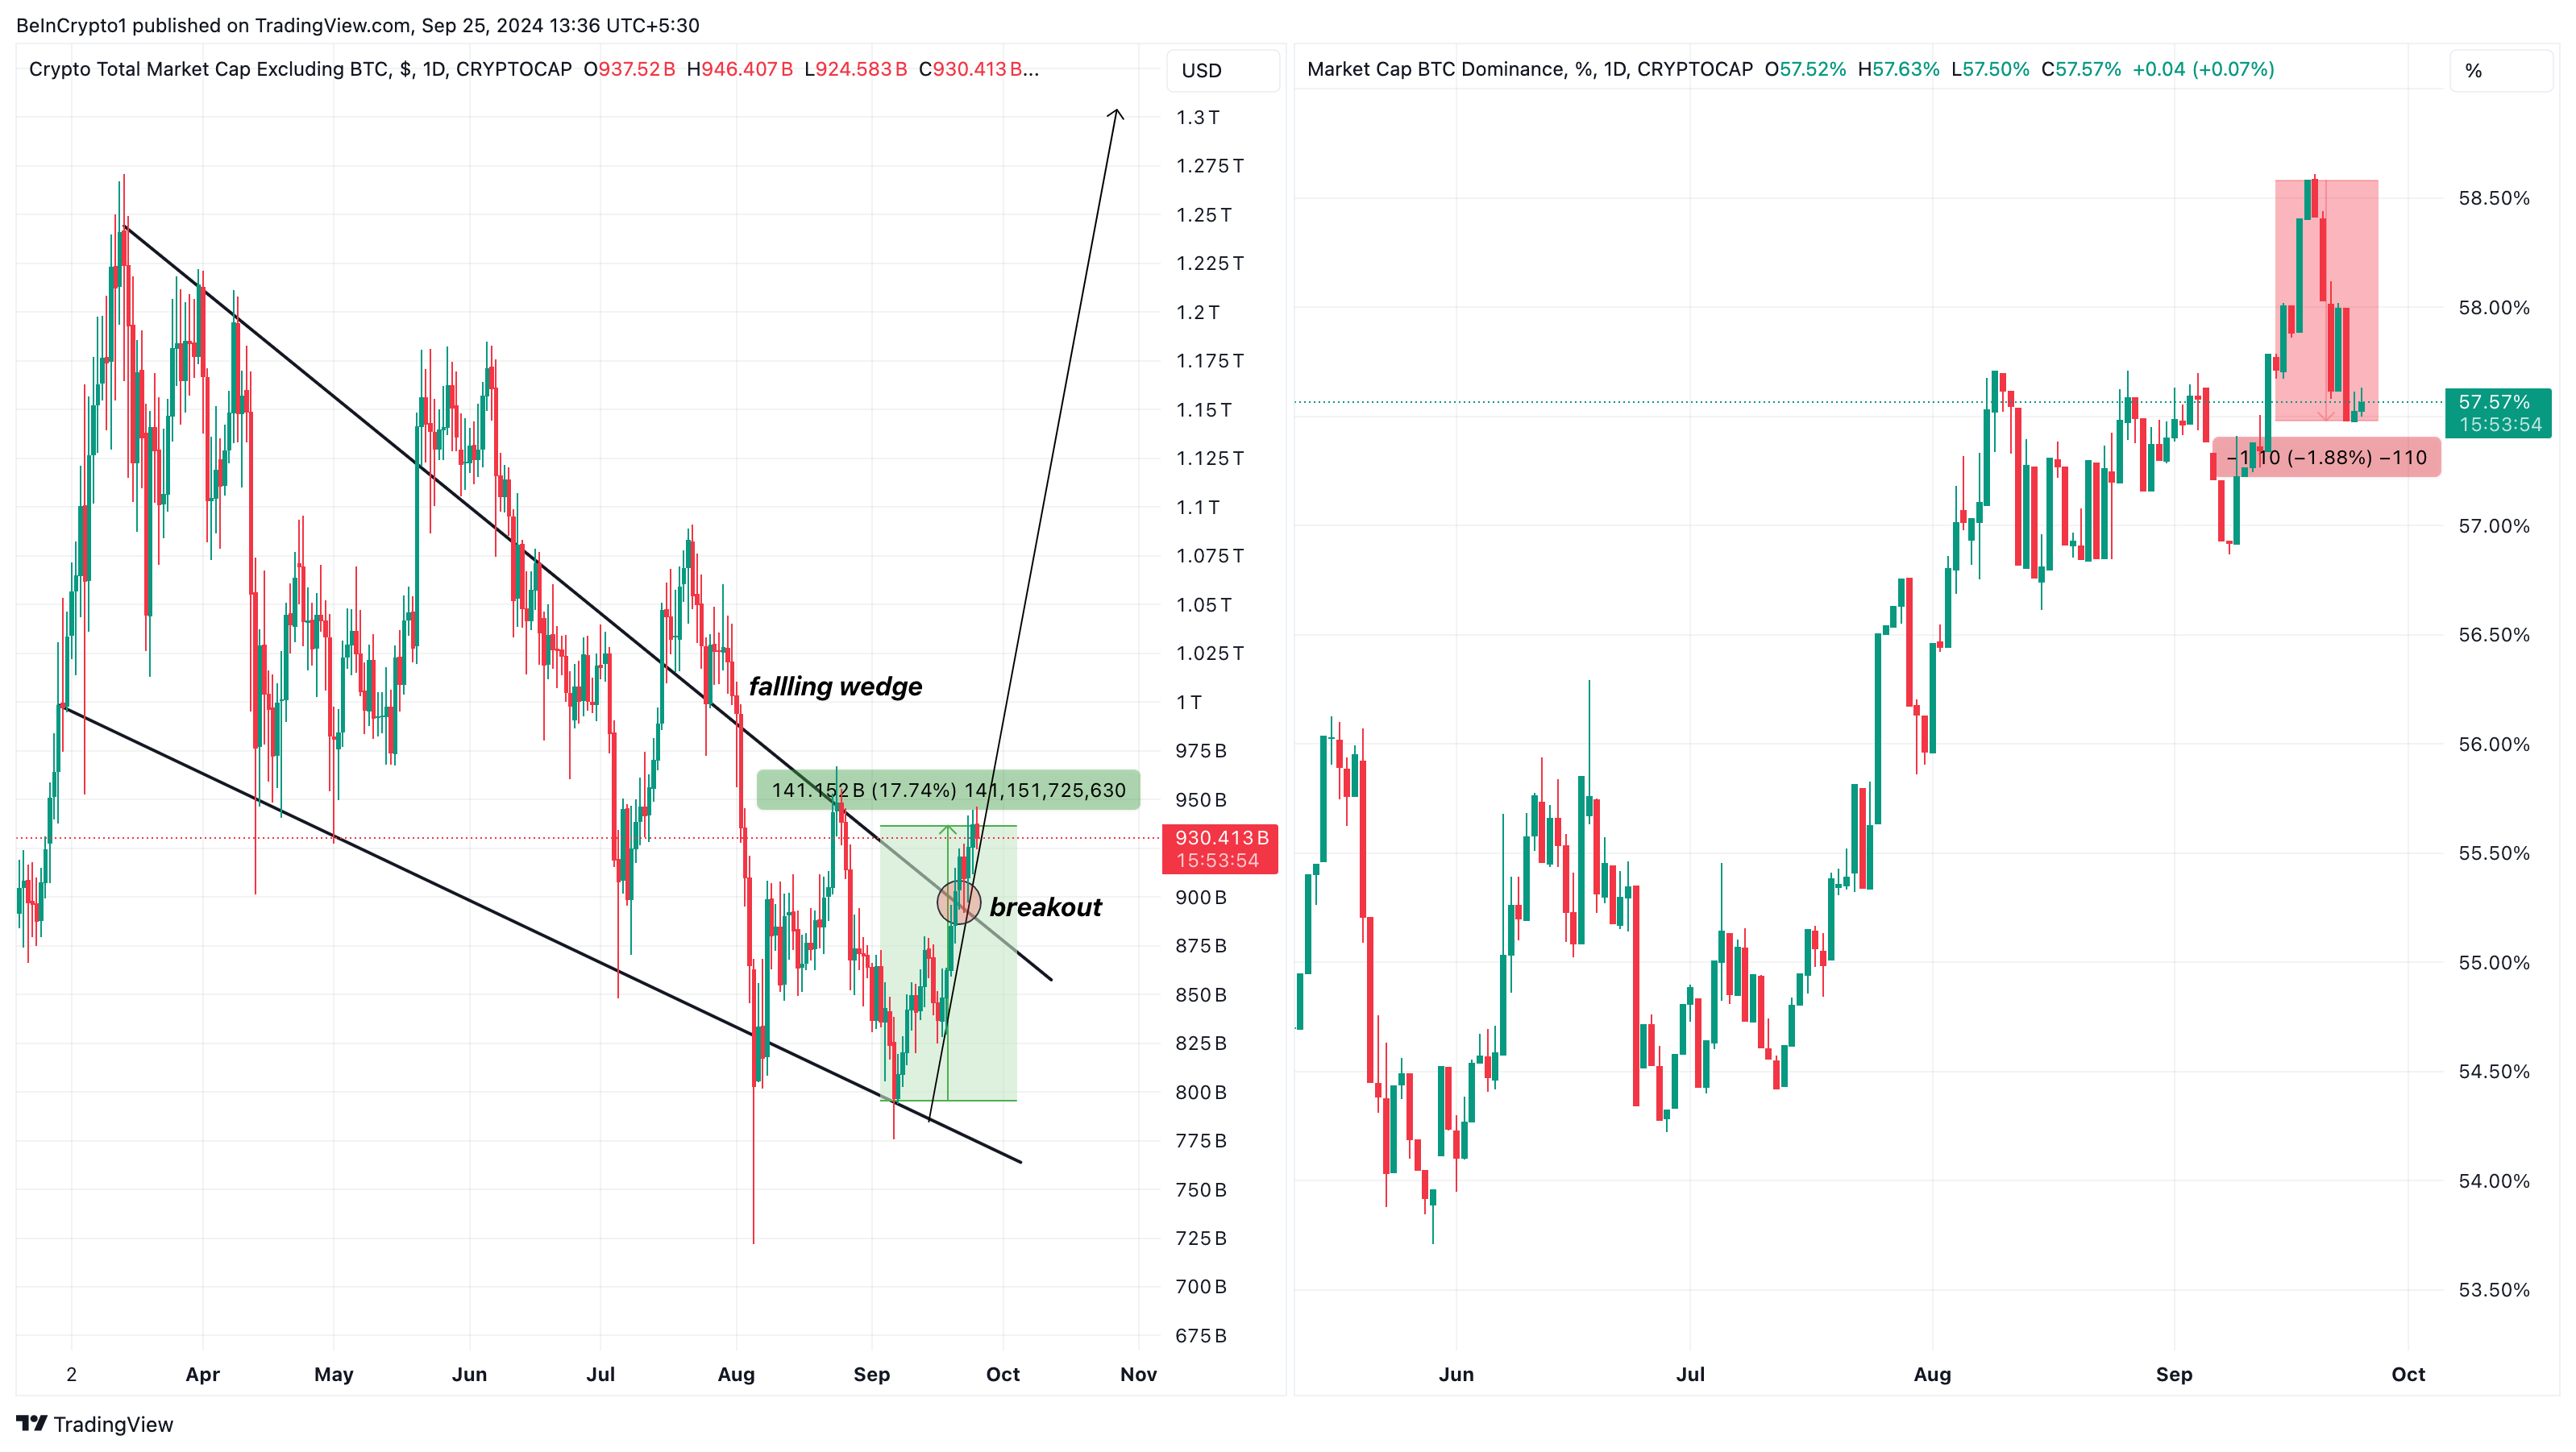
Altcoins Market Cap against Bitcoin Dominance. Altcoins Market Cap vs. Bitcoin Dominance. Source: TradingView


The breakout from the technical pattern suggests that sellers are starting to lose momentum. In turn, buyers have capitalized on the fatigue. If this trend continues, the altcoin market cap might jump toward $1.3 trillion or as high as $1.5 trillion in some months.


Analysts Predict Altcoin Season Is Near


Following this development, several prominent crypto personalities have agreed that altcoin season is very close. For instance, the Negentropic handle on X, operated by Glassnode and Swissblock founders Jan Happel, Rafael Schultze-Kraft, and Yann Allemann, shares a similar sentiment.


“Swissblock’s Altcoin Signal is at 53: We’re transitioning into an AltSeason! When BTC breaks over 64.4k, Altcoins will fly. Our framework is flagging beta plays. WIF is strong. it’s up 16%+ today with a beta of 3 to BTC. imagine the move once Bitcoin rips towards ATHs,” Negentropic said.


Miles Deutscher is another crypto analyst with such an optimistic view. According to DeDeutscher, the TOTAL3, which is the market cap of altcoins without Ethereum (ETH), could break out if it escapes rejection.


“Altcoins (TOTAL3) are on the verge of a monster breakout. There’s a chance we reject here, but if we break through – expect fireworks,” Deutscher wrote.


Interestingly, BeInCrypto’s analysis of TOTAL3 has increased by almost the same value as TOTAL2. It is also on the verge of breaking above the descending channel on the daily chart.


Read more: 11 Cryptos To Add To Your Portfolio Before Altcoin Season
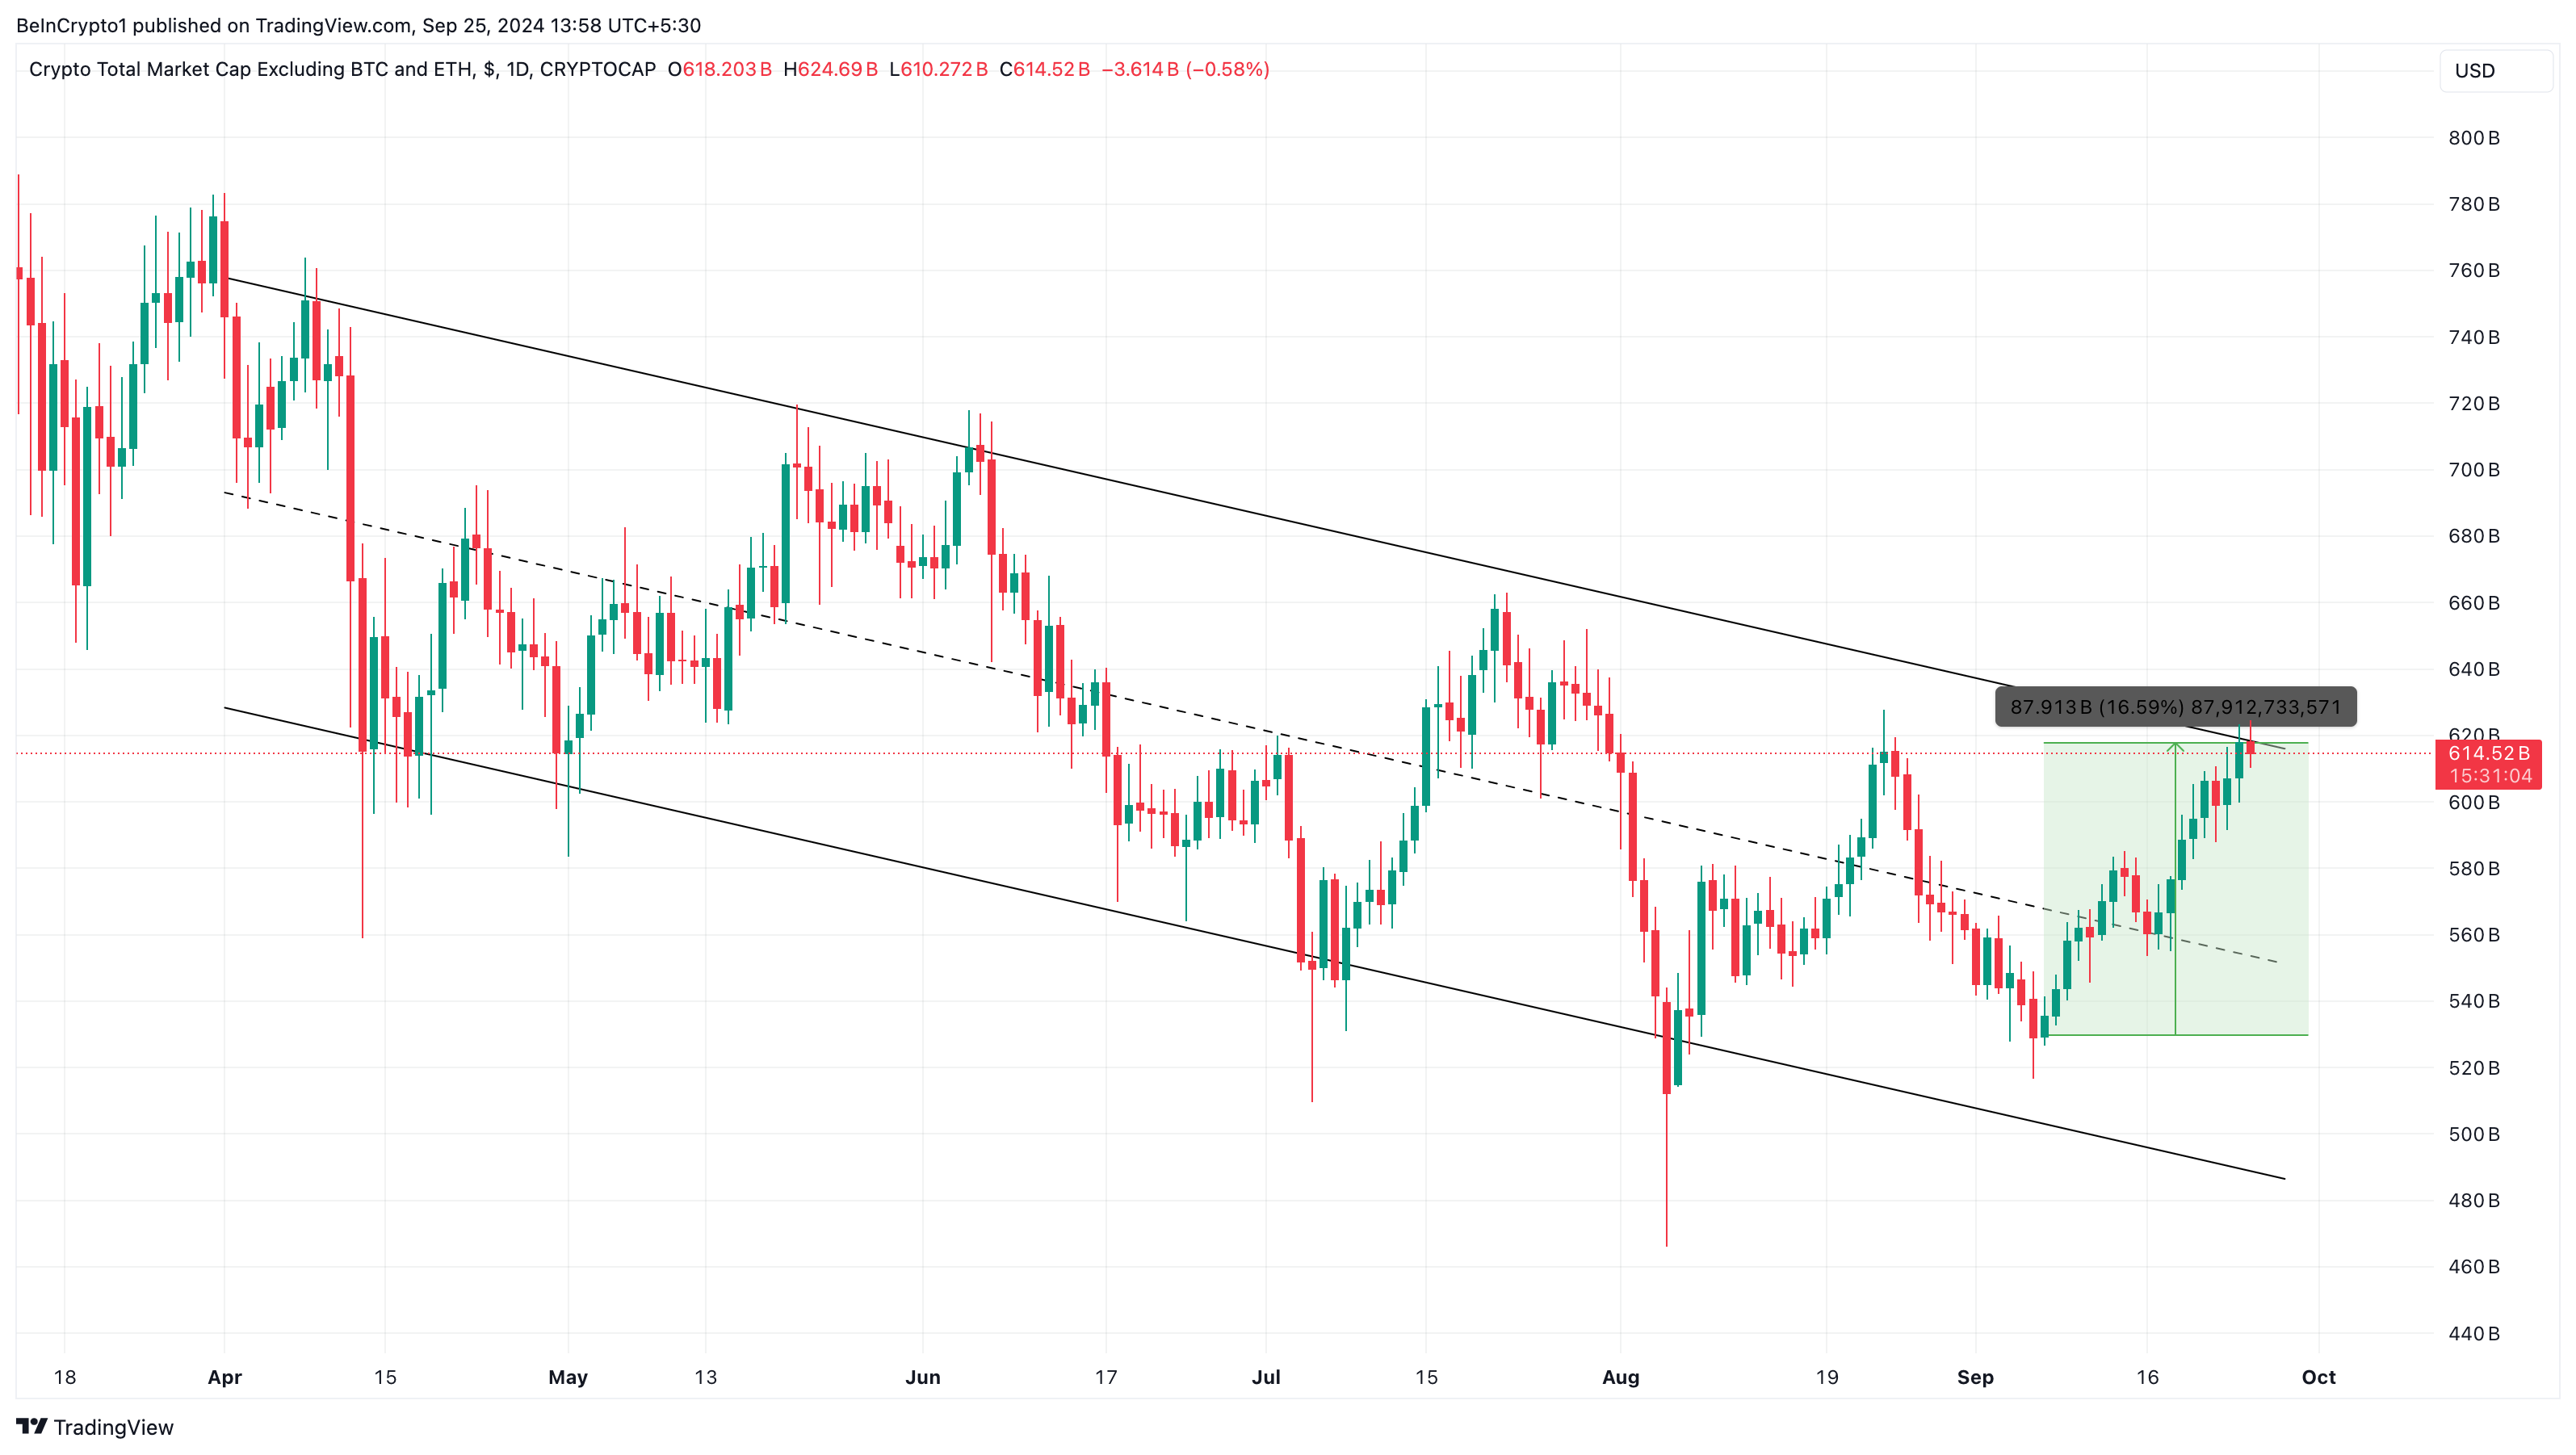
TOTAL3 Altcoins Daily Analysis. TOTAL3 Altcoins Daily Analysis. Source: TradingView


Should this breakout be successful, then altcoin season might accelerate and truly materialize. However, it remains crucial to monitor Bitcoin’s dominance. If BTC.D rebounds and altcoins market cap gets rejected, the projected rally to $1.5 trillion might not come to pass within a short period

Read more

  • Gold Price Forecast: Gold Tumbles Below $3,900 as Trump Says No Need for Iran Deal; Can October PPI Spur a Rebound?
  • * The content presented above, whether from a third party or not, is considered as general advice only.  This article should not be construed as containing investment advice, investment recommendations, an offer of or solicitation for any transactions in financial instruments.

    goTop
    quote
    Related Articles
    placeholder
    Bitcoin lost its 200-day average — but the exit started three sessions before the CPIBitcoin fell 2.5% to about $73,400 on 11 November, an 11-week low, breaking its 200-day moving average near $73,100. The 24-hour liquidation tally reached $632 to $705 million, roughly 82% of it longs. But spot ETF outflows began three sessions earlier and USDT's market cap has shrunk $6.6 billion in 60 days — the leveraged length left before the inflation print did. A double top at 81,890 and 81,080 leaves a measured target of 69,366.
    Author  Suzie
    Nov 11, Wed
    Bitcoin fell 2.5% to about $73,400 on 11 November, an 11-week low, breaking its 200-day moving average near $73,100. The 24-hour liquidation tally reached $632 to $705 million, roughly 82% of it longs. But spot ETF outflows began three sessions earlier and USDT's market cap has shrunk $6.6 billion in 60 days — the leveraged length left before the inflation print did. A double top at 81,890 and 81,080 leaves a measured target of 69,366.
    placeholder
    Bitcoin ETFs sold $1.28 billion in a week — and BTC is still above 75,000US spot Bitcoin ETFs logged $1.28 billion of net outflows in the week to Nov 6, the largest since late June, with BlackRock's IBIT accounting for $1.21 billion. Yet BTC only fell from $80,405 to $74,940, a 6.8% move. The gap between the fund flow and the price is the story: leveraged longs were flushed, but spot holders did not follow the ETFs out — and $75,000 is the line that decides whether that reading holds.
    Author  Suzie
    Nov 09, Mon
    US spot Bitcoin ETFs logged $1.28 billion of net outflows in the week to Nov 6, the largest since late June, with BlackRock's IBIT accounting for $1.21 billion. Yet BTC only fell from $80,405 to $74,940, a 6.8% move. The gap between the fund flow and the price is the story: leveraged longs were flushed, but spot holders did not follow the ETFs out — and $75,000 is the line that decides whether that reading holds.
    placeholder
    Binance replaced 95% of a $6.3bn hole — Bitcoin is trading the plumbing, not the coinBinance resumed withdrawals on November 1 after a record $6.3bn theft. In the first 9.5 hours, users withdrew $4.64bn and deposited $1.01bn, a net outflow of $3.64bn, or 2.1% of assets. Bitcoin fell to 76,173 and is now 78,473. The market is pricing the exchange, not the supply.
    Author  Suzie
    Nov 02, Mon
    Binance resumed withdrawals on November 1 after a record $6.3bn theft. In the first 9.5 hours, users withdrew $4.64bn and deposited $1.01bn, a net outflow of $3.64bn, or 2.1% of assets. Bitcoin fell to 76,173 and is now 78,473. The market is pricing the exchange, not the supply.
    placeholder
    Bitcoin is back above $80,000 — but 75% of the bounce was shorts, not buyersBitcoin trades at $80,669, back above the $80,000 line after touching $79,145 on October 24. But 75.4% of the last 24 hours of futures liquidations were shorts, CME open interest fell 36,545 BTC in October, and spot ETFs lost $773.5 million on October 22-23. Price is up; positioning is down. Here is why the bounce is a squeeze, and the four things that would make it real.
    Author  Suzie
    Oct 28, Wed
    Bitcoin trades at $80,669, back above the $80,000 line after touching $79,145 on October 24. But 75.4% of the last 24 hours of futures liquidations were shorts, CME open interest fell 36,545 BTC in October, and spot ETFs lost $773.5 million on October 22-23. Price is up; positioning is down. Here is why the bounce is a squeeze, and the four things that would make it real.
    placeholder
    Bitcoin's double top at $88,000: why $78,000 is the line that decides the next moveBitcoin trades near $82,500 (+0.47%) after twice failing at the $88,000 area, forming a potential double top with a neckline at $78,000. A break below the neckline would project a measured target near $68,200; a close back above $88,000 would invalidate the pattern. Here are the structure, the levels and what would confirm either side.
    Author  Suzie
    Oct 19, Mon
    Bitcoin trades near $82,500 (+0.47%) after twice failing at the $88,000 area, forming a potential double top with a neckline at $78,000. A break below the neckline would project a measured target near $68,200; a close back above $88,000 would invalidate the pattern. Here are the structure, the levels and what would confirm either side.
    Live Quotes
    Name / SymbolChart% Change / Price
    BTCUSD
    BTCUSD
    0.00%0.00
    ETHUSD
    ETHUSD
    0.00%0.00
    DOGEUSD
    DOGEUSD
    0.00%0.00
    SOLUSD
    SOLUSD
    0.00%0.00
    BCHUSD
    BCHUSD
    0.00%0.00
    AAVEUSD
    AAVEUSD
    0.00%0.00

    Bitcoin Related Articles

    • Bitcoin Leverage And Margin Trading in 2026: The Ultimate Beginner's Guide
    • Gold vs Bitcoin 2026: Which Is the Better Investment?Best Hedge Asset Comparison
    • Best Strategies When BTC Price Drops: From Hedging to Accumulating
    • How to Day Trade Crypto? Simplest Day Trading Strategy Ever
    • Bitcoin Price Prediction 2026-2030: Long-Term Outlook Driven by Data & Macro Cycles
    • Bitcoin Mining Beginner Guide: What Is Bitcoin Mining and How to Mine Bitcoin?

    Click to view more