Bitcoin (BTC) Price Struggles Put Short-Term Holders at a Disadvantage

Mitrade
Trending Articles
coverImg
Source: DepositPhotos

In recent months, a cohort of Bitcoin (BTC) holders has been notably affected by the coin’s struggle to stabilize above $70,000. This group comprises short-term holders (STHs) — investors who have held the asset for less than 155 days.


While the rest of the market remains profitable despite BTC’s price troubles, its STHs continue to record losses in their investments.


Bitcoin Short-Term Holders Face Record Losses


In its new report, on-chain data provider Glassnode found that BTC’s STHs continue to sit on more unrealized losses than the rest of the market. Describing them as the “primary cohort at risk,” Glassnode noted that the magnitude of the losses incurred by this category of coin holders has increased over the past few months.


The on-chain analytics firm assessed BTC’s STH market value to realized value (MVRV) ratio. It found that its value has remained below one and is now at “ levels similar to Aug 2023 during the recovery rally after the FTX failure.”

Bitcoin STH market value to realized value ratio.
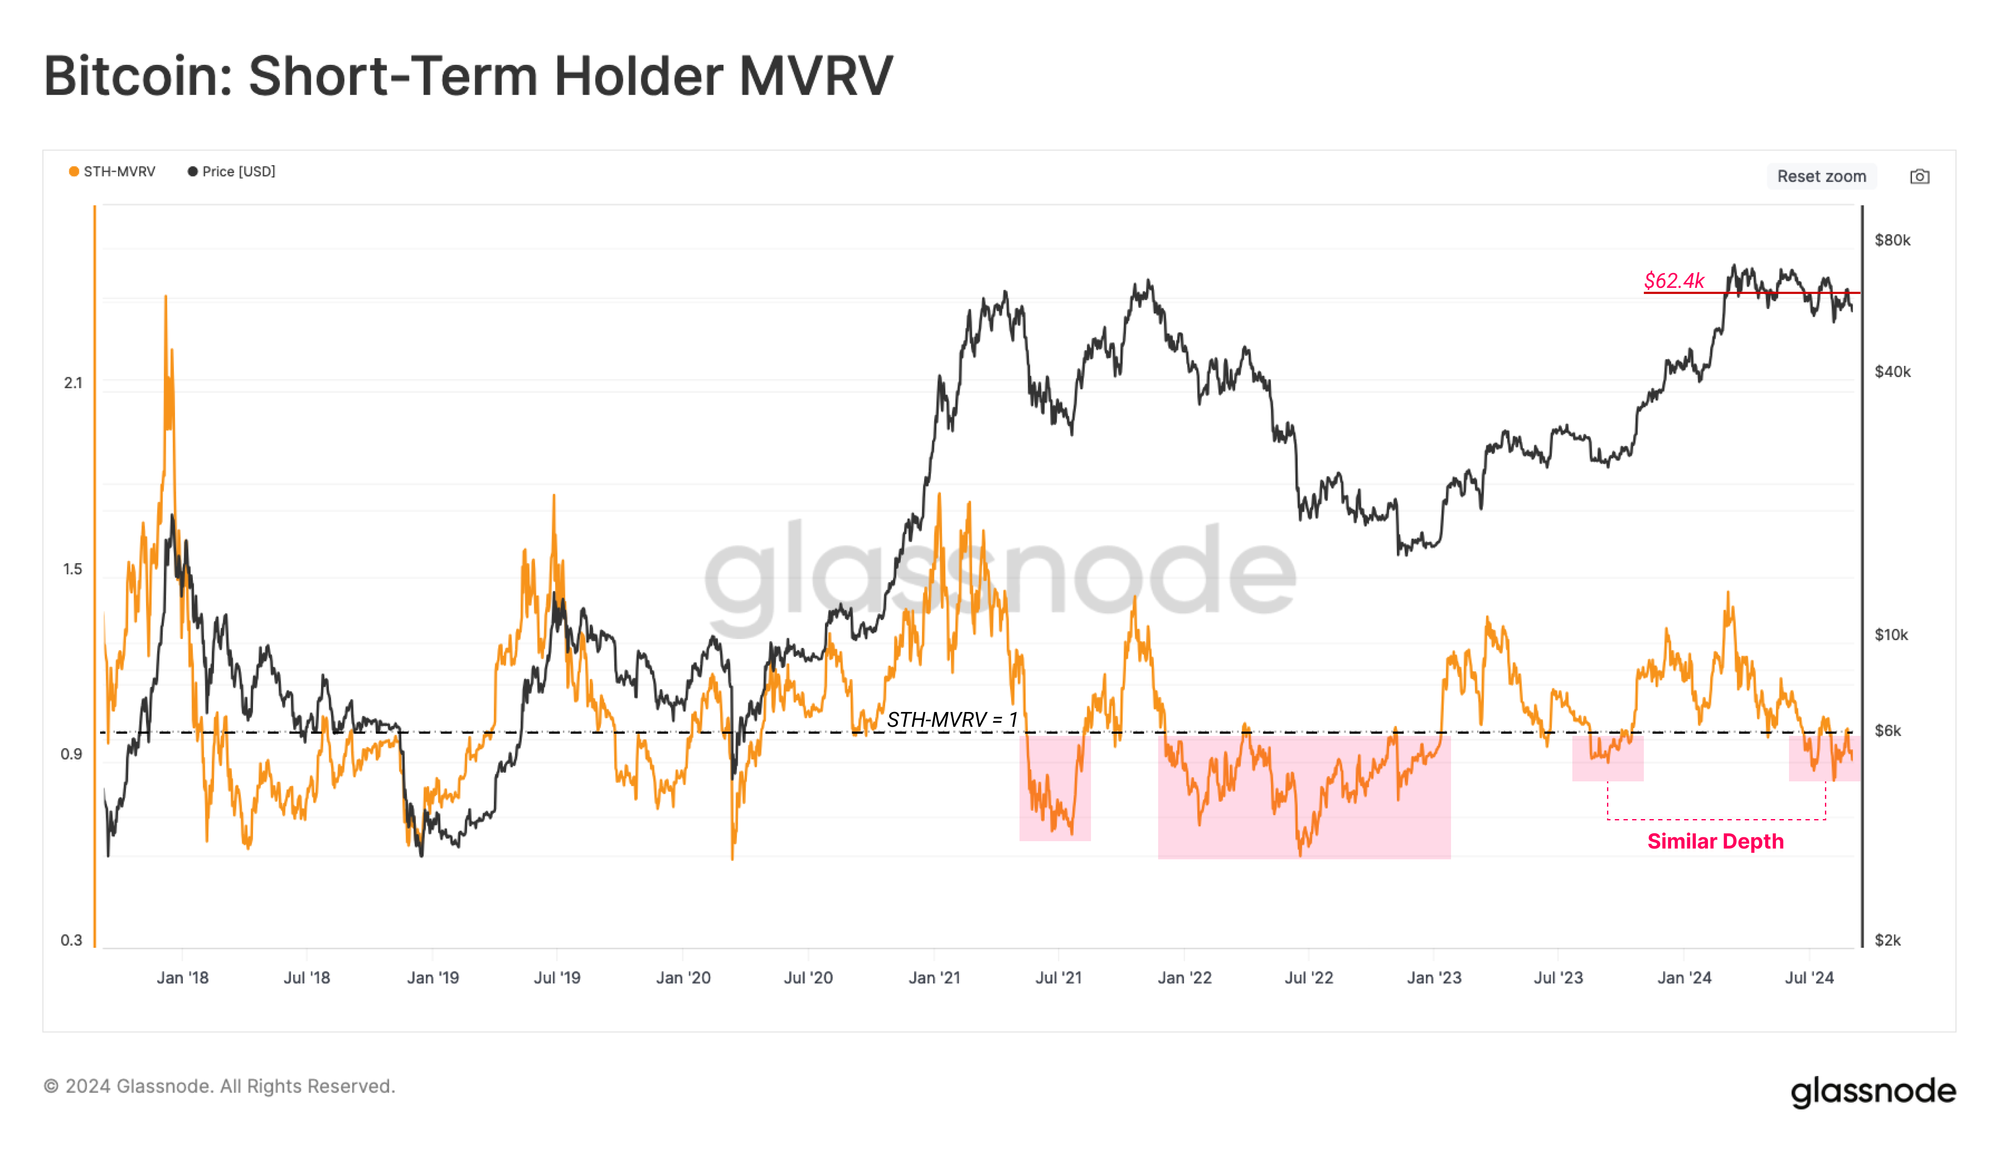
Bitcoin STH Market Value to Realized Value Ratio. Source: Glassnode


When an asset’s MVRV ratio is below one, its market value is less than the average price paid to acquire it by holders. Therefore, if they sell, they would incur losses. 

“This tells us that the average new investor is holding an unrealized loss. Generally speaking, until the spot price reclaims the STH cost basis of $62.4k, there is an expectation for further market weakness,” Glassnode said.


Due to recent spike in losses, Bitcoin short-term holders (STHs) have adjusted their behavior. According to Glassnode, “the wealth held by new-demand investors has declined over recent months” as these STHs distributed their coins.


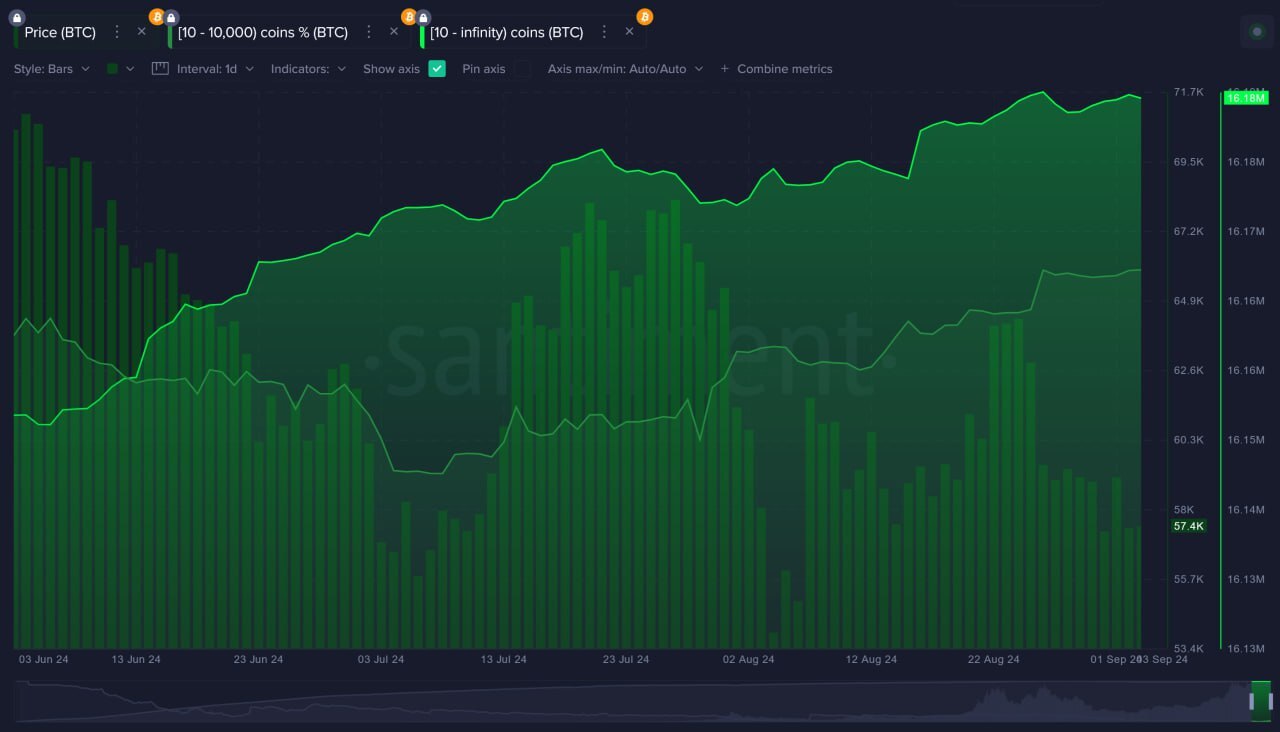
Conversely, long-term holders (LTHs) have reduced profit-taking and ramped up accumulation, showing contrasting strategies between the two groups. This pattern is evident amongst BTC whales as well.

“For Bitcoin, the main chart that continues to look encouraging is this one showing that whales continue to accumulate. Over the past 3 months, 10+ BTC wallets have added a combined 34.2K more coins,” Brian Quinlivan, lead analyst at Santiment, noted in an exclusive interview with BeinCrypto.


Read more: What Happened at the Last Bitcoin Halving? Predictions for 2024

Bitcoin Whale Activity.Bitcoin Whale Activity. Source: Santiment


BTC Price Prediction: More Pain Ahead


BTC’s technical setup suggests that the leading coin is poised for a further decline. At press time, its Awesome Oscillator, which measures market momentum, is negative.


At -1,545, BTC’s Awesome Oscillator signals that its short-term price movements are weaker than its longer-term movements, suggesting downward momentum. Additionally, its Chaikin Money Flow (CMF), in a downtrend, signals liquidity exit from the BTC market.


Read more: Bitcoin Halving History: Everything You Need To Know

btc price prediction
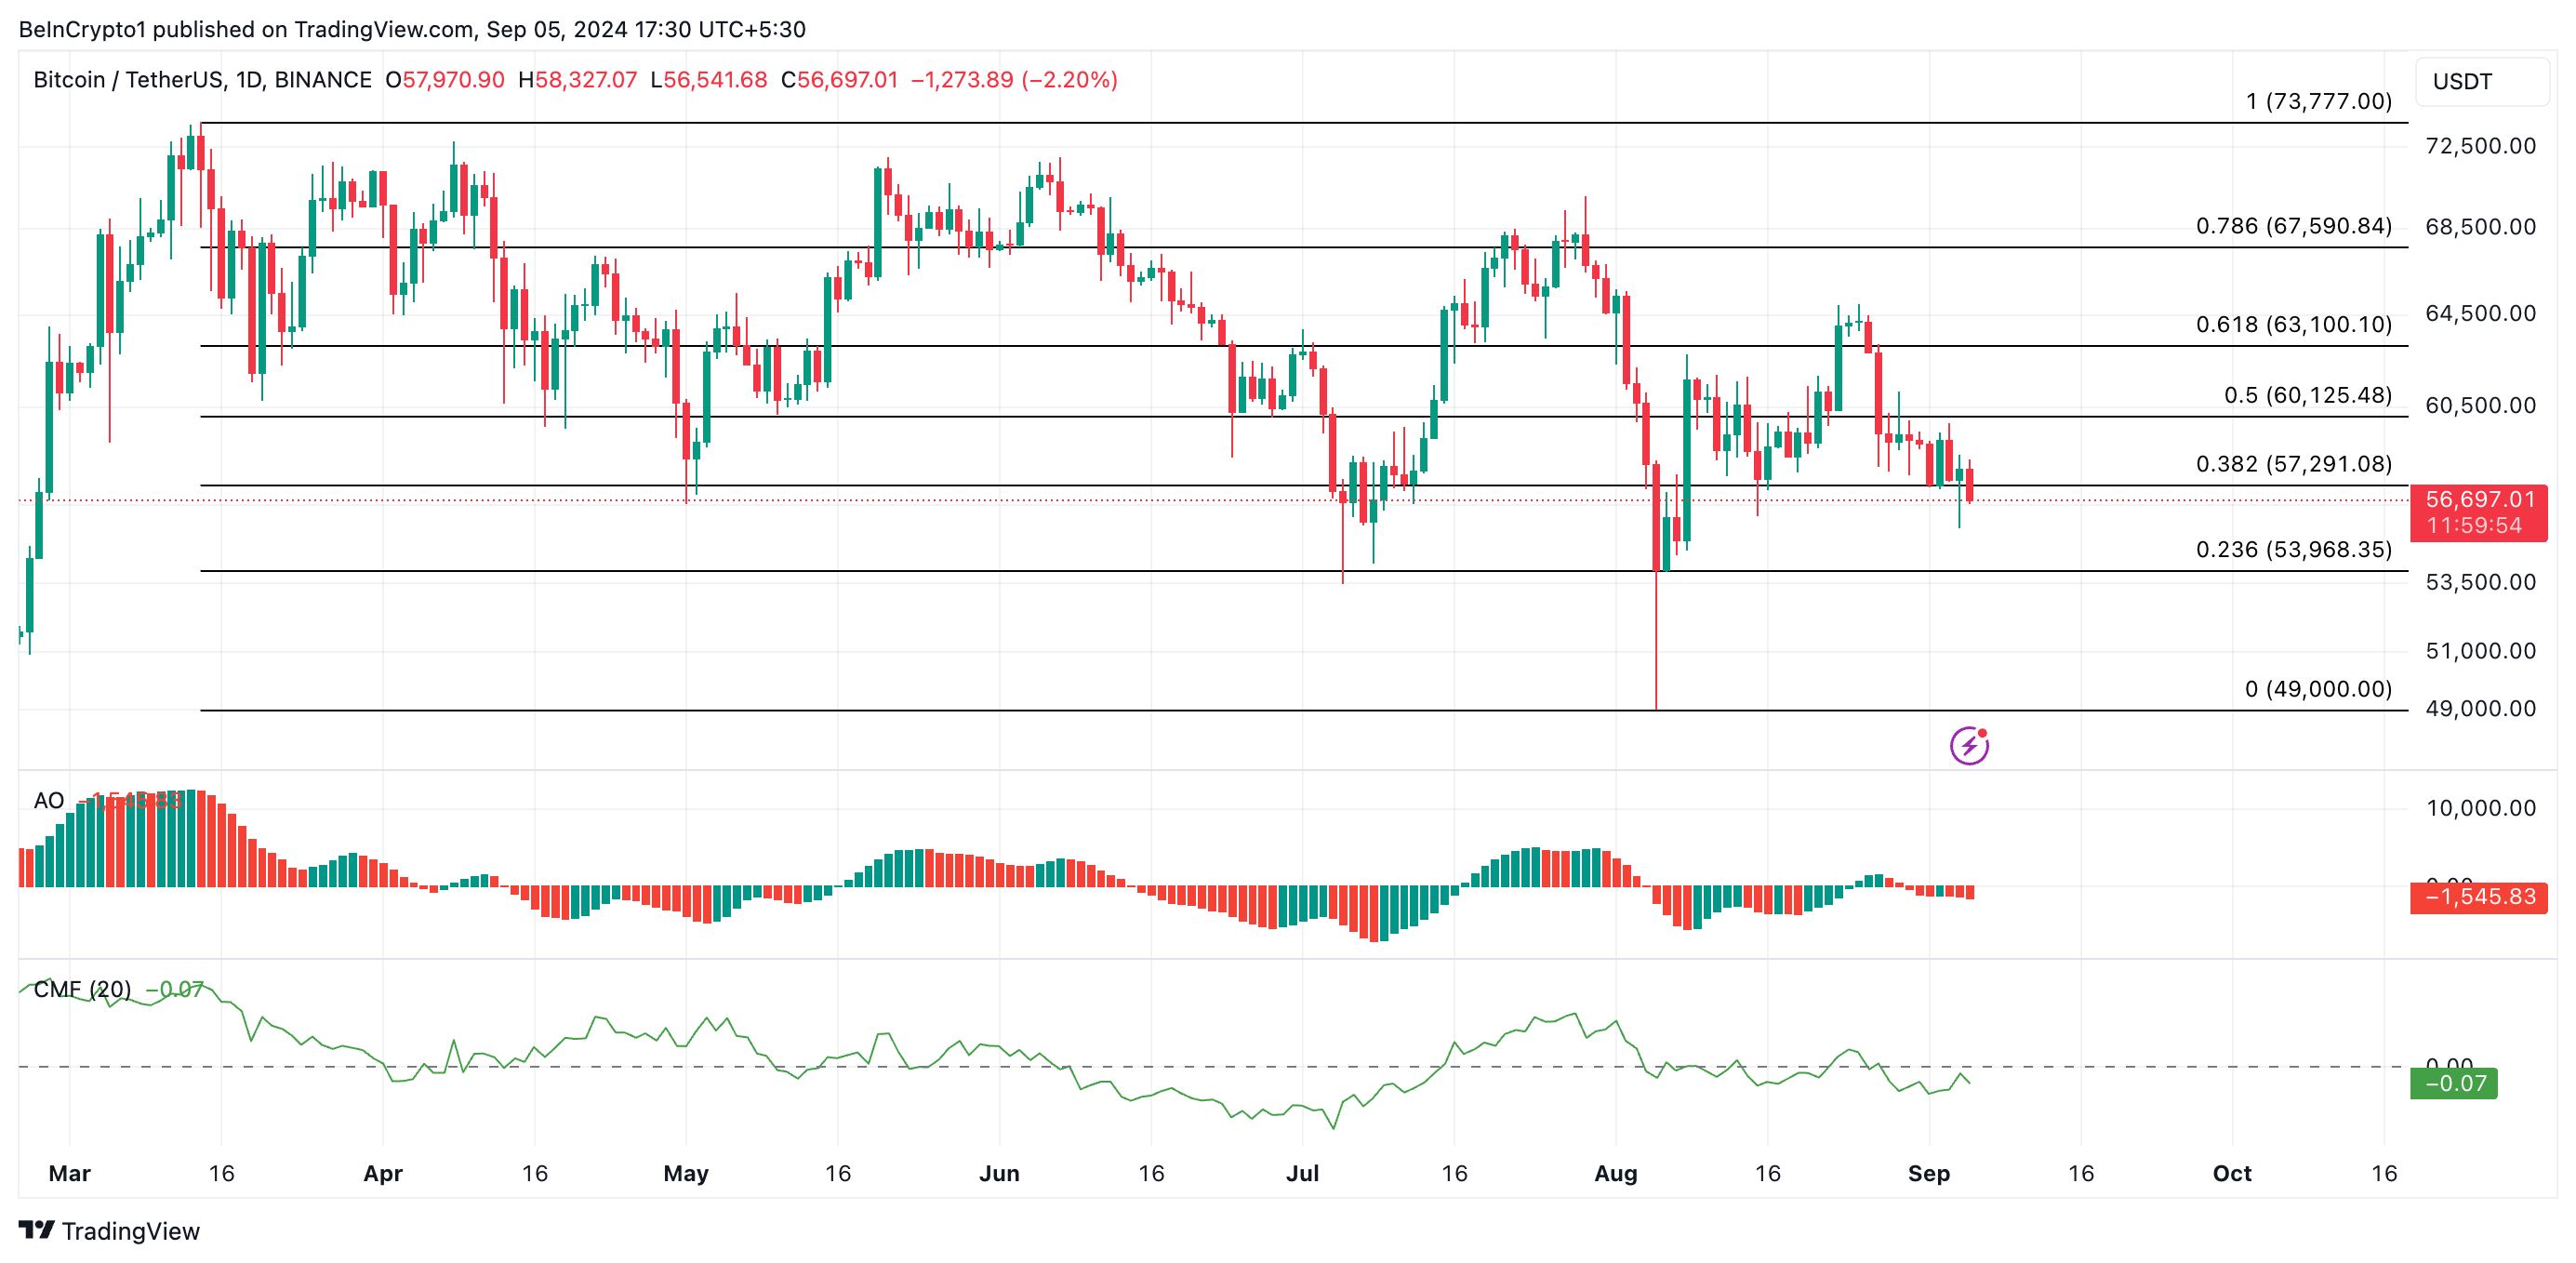
Bitcoin Price Analysis. Source: TradingView


If this trend continues, the king coin’s price may fall to $53,968. However, if buying activity outweighs selling pressure, the coin’s value may rally to $57,291.

Read more

  • Gold remains bid as lack of Fed clarity and geopolitical frictions persist
  • * The content presented above, whether from a third party or not, is considered as general advice only.  This article should not be construed as containing investment advice, investment recommendations, an offer of or solicitation for any transactions in financial instruments.

    goTop
    quote
    Related Articles
    placeholder
    Senate Delays Crypto Market Structure Hearings to Early 2026The Senate Banking Committee has postponed cryptocurrency market structure hearings until 2026, citing ongoing bipartisan negotiations.
    Author  Mitrade
    19 hours ago
    The Senate Banking Committee has postponed cryptocurrency market structure hearings until 2026, citing ongoing bipartisan negotiations.
    placeholder
    Bitcoin Slides 5% as Sellers Lean In — Can BTC Reclaim $88,000?Bitcoin has dropped back below $88,000 after rolling over from $90,500, with price still trading under the 100-hour Simple Moving Average. The sell-off found a floor at $85,151, and BTC is now consolidating near that base, but rebounds are facing pressure from a bearish trend line around $89,000. Bulls need to retake $88,000–$89,000 to ease downside risk; failure to do so keeps $85,500–$85,000 and then $83,500 in play, with $80,000 as the deeper “line in the sand.” Bitcoin (BTC) is back in damage-control mode after a sharp pullback wiped out recent gains. The price failed to reclaim the $90,000–$90,500 band, rolled over, and slid through $88,500 before briefly dipping under $87,000. Buyers did show up around $85,000, but the rebound so far looks more like stabilization than a clear trend reversal. Bitcoin dips hard, finds a bid near $85,000(h3) BTC’s latest move lower began when it couldn’t build follow-through above $90,000 and $90,500. Once that upside stalled, sellers took control and pushed price down through $88,500. The slide accelerated enough to spike below $87,000, but the market didn’t free-fall. Bulls defended the $85,000 zone, printing a low at $85,151. Since then, Bitcoin has been consolidating below the 23.6% Fibonacci retracement of the drop from the $93,560 swing high to the $85,151 low — a clue that the bounce is still shallow and that sellers haven’t fully backed off yet. Structurally, BTC is still on the back foot: It’s trading below $88,000, and It remains below the 100-hour Simple Moving Average, keeping short-term trend pressure pointed downward. Resistance is layered, and $89,000 is the problem area(h3) If bulls try to turn this into a recovery, they’ll have to climb through multiple ceilings in quick succession. First, BTC faces resistance around $87,150, followed by a more meaningful barrier near $87,500. From there, the market’s attention snaps back to $88,000 — the level BTC just lost and now needs to reclaim. A close back above $88,000 would improve the tone, but it doesn’t solve the bigger issue: there’s a bearish trend line on the hourly BTC/USD chart (Kraken feed) with resistance near $89,000, which also lines up with the next technical hurdle. If BTC can push through $89,000 and hold, the rebound could extend toward $90,000, with follow-through targets at $91,000 and $91,500. But until price clears that $88,000–$89,000 zone, rallies are at risk of being sold rather than chased. If BTC fails to reclaim resistance, the downside path is clear(h3) The near-term bear case is simple: if Bitcoin can’t climb back above the $87,000 area and keep traction, sellers may attempt another leg lower. Support levels line up like this: Immediate support: $85,500 First major support: $85,000 Next support: $83,500 Then $82,500 in the near term Below that, the major “don’t break this” level is still $80,000. If BTC slips under $80,000, the risk of acceleration to the downside increases significantly — not because it’s magic, but because it’s the kind of psychological and structural level that tends to trigger forced de-risking. Indicators: momentum still leans bearish(h3) The intraday indicators aren’t offering much comfort yet: Hourly MACD is losing pace in the bearish zone. Hourly RSI remains below 50, suggesting sellers still have the upper hand on short timeframes. So while the $85,000 defense held for now, the market hasn’t flipped bullish — it’s just stopped bleeding.
    Author  Mitrade
    22 hours ago
    Bitcoin has dropped back below $88,000 after rolling over from $90,500, with price still trading under the 100-hour Simple Moving Average. The sell-off found a floor at $85,151, and BTC is now consolidating near that base, but rebounds are facing pressure from a bearish trend line around $89,000. Bulls need to retake $88,000–$89,000 to ease downside risk; failure to do so keeps $85,500–$85,000 and then $83,500 in play, with $80,000 as the deeper “line in the sand.” Bitcoin (BTC) is back in damage-control mode after a sharp pullback wiped out recent gains. The price failed to reclaim the $90,000–$90,500 band, rolled over, and slid through $88,500 before briefly dipping under $87,000. Buyers did show up around $85,000, but the rebound so far looks more like stabilization than a clear trend reversal. Bitcoin dips hard, finds a bid near $85,000(h3) BTC’s latest move lower began when it couldn’t build follow-through above $90,000 and $90,500. Once that upside stalled, sellers took control and pushed price down through $88,500. The slide accelerated enough to spike below $87,000, but the market didn’t free-fall. Bulls defended the $85,000 zone, printing a low at $85,151. Since then, Bitcoin has been consolidating below the 23.6% Fibonacci retracement of the drop from the $93,560 swing high to the $85,151 low — a clue that the bounce is still shallow and that sellers haven’t fully backed off yet. Structurally, BTC is still on the back foot: It’s trading below $88,000, and It remains below the 100-hour Simple Moving Average, keeping short-term trend pressure pointed downward. Resistance is layered, and $89,000 is the problem area(h3) If bulls try to turn this into a recovery, they’ll have to climb through multiple ceilings in quick succession. First, BTC faces resistance around $87,150, followed by a more meaningful barrier near $87,500. From there, the market’s attention snaps back to $88,000 — the level BTC just lost and now needs to reclaim. A close back above $88,000 would improve the tone, but it doesn’t solve the bigger issue: there’s a bearish trend line on the hourly BTC/USD chart (Kraken feed) with resistance near $89,000, which also lines up with the next technical hurdle. If BTC can push through $89,000 and hold, the rebound could extend toward $90,000, with follow-through targets at $91,000 and $91,500. But until price clears that $88,000–$89,000 zone, rallies are at risk of being sold rather than chased. If BTC fails to reclaim resistance, the downside path is clear(h3) The near-term bear case is simple: if Bitcoin can’t climb back above the $87,000 area and keep traction, sellers may attempt another leg lower. Support levels line up like this: Immediate support: $85,500 First major support: $85,000 Next support: $83,500 Then $82,500 in the near term Below that, the major “don’t break this” level is still $80,000. If BTC slips under $80,000, the risk of acceleration to the downside increases significantly — not because it’s magic, but because it’s the kind of psychological and structural level that tends to trigger forced de-risking. Indicators: momentum still leans bearish(h3) The intraday indicators aren’t offering much comfort yet: Hourly MACD is losing pace in the bearish zone. Hourly RSI remains below 50, suggesting sellers still have the upper hand on short timeframes. So while the $85,000 defense held for now, the market hasn’t flipped bullish — it’s just stopped bleeding.
    placeholder
    Macro Analysts: Hawkish Japan Could Push Bitcoin Below $70KAnalysts predict Bitcoin may face further declines towards the $70,000 mark if the Bank of Japan raises interest rates as expected.
    Author  Mitrade
    Dec 15, Mon
    Analysts predict Bitcoin may face further declines towards the $70,000 mark if the Bank of Japan raises interest rates as expected.
    placeholder
    Fed Cuts Rates: Bitcoin Rallies Then Retreats - Bear Market Ahead?TradingKey - Fed Rate Cut Fails to Buoy Bitcoin, Signaling Bull Market's End?Early on December 11,the Federal Reserve delivered an expected 25 basis point rate cut.Bitcoin (BTC) briefly surged to $94,
    Author  TradingKey
    Dec 11, Thu
    TradingKey - Fed Rate Cut Fails to Buoy Bitcoin, Signaling Bull Market's End?Early on December 11,the Federal Reserve delivered an expected 25 basis point rate cut.Bitcoin (BTC) briefly surged to $94,
    placeholder
    Bitcoin Breaks Above $94K Again: Is the Bull Market Back?​Bitcoin has reclaimed the $94,000 mark, suggesting a possible short-term bullish uptrend, despite concerns over liquidity.
    Author  Mitrade
    Dec 10, Wed
    ​Bitcoin has reclaimed the $94,000 mark, suggesting a possible short-term bullish uptrend, despite concerns over liquidity.

    Bitcoin Related Articles

    • Trading Chart Patterns:Ultimate Guide to Price Action
    • How to Day Trade Crypto? Simplest Day Trading Strategy Ever
    • Places that Provide Cheapest Ways to Buy Bitcoin In 2025
    • 10 Best Crypto With Most Potential to Buy and invest in 2025 - Top Picks from Expert Traders
    • Top 10 Bitcoin Mining Apps for Android & iOS During 2024
    • How To Buy Bitcoin In Malaysia? Top 7 Best Crypto Exchanges & Trading Apps

    Click to view more