WTI Price Analysis: Oil prices Drop as the USD Recovers, OPEC Cuts

Mitrade
Trending Articles
coverImg
Source: DepositPhotos

■  WTI declined towards $73.25, seeing 1.50% losses.

■  The US Dollar measured by the DXY index rose towards 103.70, weighting on the black gold.

■  Doubts on further production cuts by OPEC also apply pressure on the price.


At the start of the week, the West Texas Intermediate (WTI) barrel tallied a third consecutive day of losses, triggered by the strength of the US Dollar and the speculation amongst traders that the Organization of the Petroleum Exporting Countries (OPEC) won't deliver any more production cuts after its last decision. 


Last week, the OPEC+ countries, spearheaded by Saudi Arabia,  collectively decided to significantly reduce their oil production by approximately 2.2 million barrels per day (bpd) for the early part of next year. That being said, the reaction of the Oil prices was to the downside as markets were disappointed in the size of the cuts and were left sceptical about further reductions in the future.


In addition, the global uncertainty of the global demand for black gold opens the downside for the WTI, with major global economies starting to see the effects of their contractive monetary policies on their economies. In line with that, the US will report key labor market figures this week, ending with a Nonfarm Payrolls report on Friday, and their outcome will likely shape the upcoming decisions from the Federal Reserve (Fed). If the data justifies further tightening, the American economy (the largest Oil consumer) may face additional challenges that could negatively affect the oil demand.


WTI Levels to watch

According to the daily chart, the outlook has turned bearish for the WTI. This is mainly because the Relative Strength Index (RSI) and Moving Average Convergence Divergence (MACD) reside deep in negative territory and as  the price is seen below its 20,100 and 200-day Simple Moving Averages (SMA). This indicates that on the shorter and broader scales, the sellers are dominating.


●  Resistance Levels: $75.00, $76.15 (20-day SMA), $77.00.


●  Support Levels: $72.80, $72.30,$71.00.

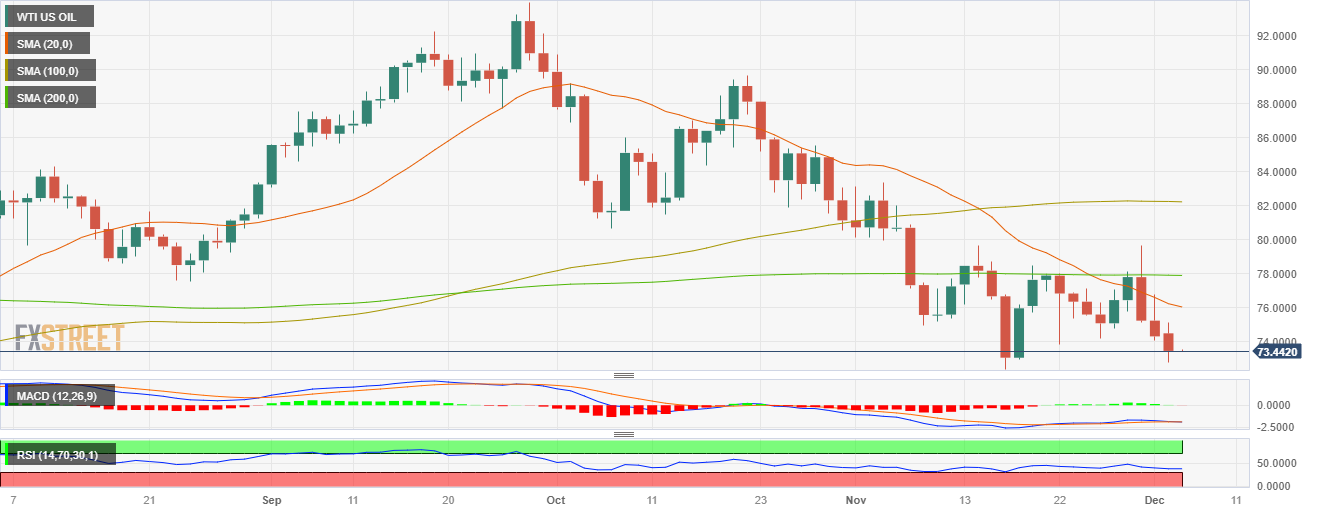
WTI Daily chart, Source: FXStreet.


Read more

  • WTI eases below $103.50 as US, Iran reportedly seeking 45-day ceasefire
  • Note: If you want to share the article 《WTI Price Analysis: Oil prices Drop as the USD Recovers, OPEC Cuts 》, make sure you retain the original link. For more information, please visit Insights or browse www.mitrade.com.

    * The content presented above, whether from a third party or not, is considered as general advice only.  This article should not be construed as containing investment advice, investment recommendations, an offer of or solicitation for any transactions in financial instruments.

    goTop
    quote
    Related Articles
    placeholder
    Trump Openly Seizes Oil, Threatening to “Control Iran Overnight.” WTI Crude Has Doubled to $115 This Year; Will Oil Prices Face More Variables?On April 6, Trump remarked regarding the Iran issue that he could "control the entire country overnight" and indicated that the deadline for ceasefire negotiations could be tomorrow (the
    Author  TradingKey
    17 hours ago
    On April 6, Trump remarked regarding the Iran issue that he could "control the entire country overnight" and indicated that the deadline for ceasefire negotiations could be tomorrow (the
    placeholder
    WTI edges higher above $110 as Trump intensifies Iran's infrastructure threats West Texas Intermediate (WTI), the US crude oil benchmark, is trading around $103.60 during the early Asian trading hours on Tuesday.
    Author  TradingKey
    23 hours ago
    West Texas Intermediate (WTI), the US crude oil benchmark, is trading around $103.60 during the early Asian trading hours on Tuesday.
    placeholder
    WTI eases below $103.50 as US, Iran reportedly seeking 45-day ceasefireWest Texas Intermediate (WTI), the US crude oil benchmark, is trading around $103.30 during the early European trading hours on Monday. The WTI price retreats after reports that the United States (US) and Iran are making a push for a 45-day ceasefire. 
    Author  FXStreet
    Apr 06, Mon
    West Texas Intermediate (WTI), the US crude oil benchmark, is trading around $103.30 during the early European trading hours on Monday. The WTI price retreats after reports that the United States (US) and Iran are making a push for a 45-day ceasefire. 
    placeholder
    Spot Crude Oil Breaks $140. First Time Since 2008. Oil Market’s Most Severe Shock in History Is Here. On Thursday, April 2, Dated Brent crude prices reached $141.37 per barrel, the highest level since 2008, surpassing the peak set during the outbreak of the Russia-Ukraine conflict in 2022
    Author  TradingKey
    Apr 03, Fri
    On Thursday, April 2, Dated Brent crude prices reached $141.37 per barrel, the highest level since 2008, surpassing the peak set during the outbreak of the Russia-Ukraine conflict in 2022
    placeholder
    Brent: Forecast lifted with $150 risk – Societe GeneraleSociete Generale’s commodities team has revised its Oil outlook, warning Brent could spike towards $150/bbl in a higher‑for‑longer scenario if the Strait of Hormuz is shut for two months.
    Author  FXStreet
    Mar 31, Tue
    Societe Generale’s commodities team has revised its Oil outlook, warning Brent could spike towards $150/bbl in a higher‑for‑longer scenario if the Strait of Hormuz is shut for two months.
    Live Quotes
    Name / SymbolChart% Change / Price
    USOIL
    USOIL
    0.00%0.00
    USOIL-F
    USOIL-F
    0.00%0.00
    UKOIL
    UKOIL
    0.00%0.00

    Oil Related Articles

    • Best Oil Trading Platforms in 2026: A Complete Guide for Retail Traders
    • Should I Invest in Oil Right Now? The 2026 Oil Price Forecast
    • Crude Oil Trading: How To Invest In WTI/Brent Oil?
    • WTI Moves Upward Near $75.50 on Dovish Fed Outlook, Maersk, CMA CGM Return to Red Sea

    Click to view more