


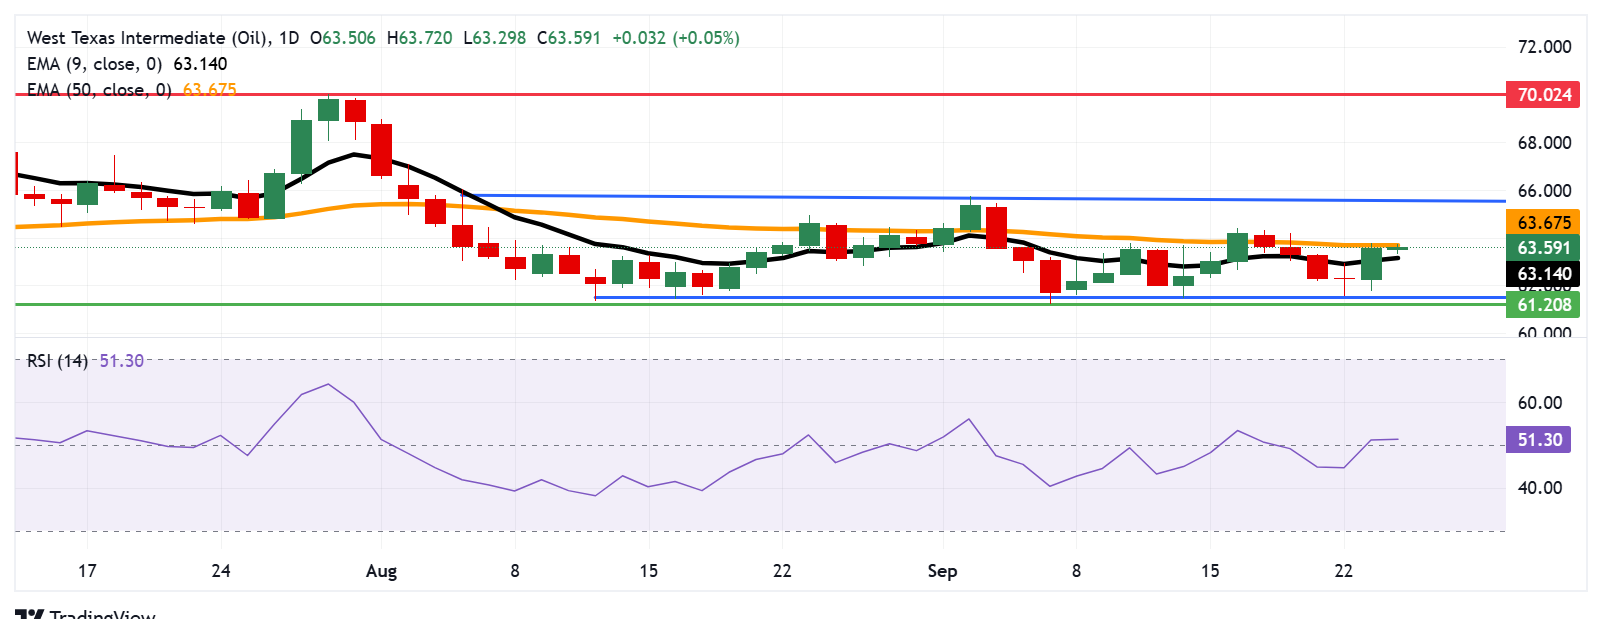
WTI price tests the immediate resistance at the 50-day EMA of $63.67.
The 14-day Relative Strength Index sits above 50, signaling an active bullish bias.
The initial support appears at the nine-day EMA of $63.14.
West Texas Intermediate (WTI) Oil price extends its gains for the second successive session, trading around $63.60 per barrel during the European hours on Wednesday. The technical analysis of the daily chart suggests that the Oil price remains within a rectangular pattern, indicating a consolidation phase.
The 14-day Relative Strength Index (RSI) is positioned slightly above the 50 level, suggesting a bullish trend is active. Additionally, the WTI price has moved above the nine-day Exponential Moving Average (EMA), indicating that short-term price momentum is stronger.
The WTI price is testing its immediate resistance at the 50-day EMA of $63.67, followed by the upper boundary of the rectangle around $65.70. A break above the rectangle would give rise to bullish bias and support the crude price to explore the region around the five-month high of $70.02, which was reached on July 30.
On the downside, the WTI price would find its primary support at the nine-day EMA of $63.14. A break below this level would weaken the short-term price momentum and prompt the crude Oil price to approach the rectangle’s lower boundary around the $61.60, followed by the three-month low of $61.20, recorded on September 5.
WTI: Daily Chart
* The content presented above, whether from a third party or not, is considered as general advice only. This article should not be construed as containing investment advice, investment recommendations, an offer of or solicitation for any transactions in financial instruments.


