

Top 3 Price Prediction: BTC, ETH and XRP momentum fades, signaling deeper corrections

- Bitcoin Drops to $70,000. U.S. Government Refuses to Bail Out Market, End of Bull Market or Golden Pit?
- Gold rallies further beyond $5,050 amid flight to safety, dovish Fed expectations
- Bitcoin Bottom Debate: $70,000 or $50,000?
- A Crash After a Surge: Why Silver Lost 40% in a Week?
- Bitcoin Rout. Bridgewater Founder Dalio Publicly Backs Gold.
- WTI declines below $63.00 as US-Iran talks loom

Bitcoin price hovers around $112,300 on Wednesday, slipping almost 3% over the last two days.
Ethereum closes below its daily support at $4,232, raising the risk of an extended downward move.
XRP hovers around $2.83 after correcting nearly 5% so far this week.
Bitcoin (BTC), Ethereum (ETH), and Ripple (XRP) steadied on Wednesday after falling nearly 3%, 6%, and 5%, respectively, so far this week. The top three cryptocurrencies are showing signs of continued weakness, with fading momentum indicating deeper corrections may be on the horizon.
Bitcoin could correct further as momentum continues to weaken
Bitcoin price failed to find support around the daily level of $116,000 on Friday and declined 3.19% over the next four days, closing below the 50-day Exponential Moving Average at $113,794. At the time of writing on Wednesday, it hovers at around $112,157.
If BTC continues its ongoing correction, it could extend its decline to retest the next daily support at $107,245.
The Relative Strength Index (RSI) on the daily chart reads 42, below its neutral level of 50, indicating strong bearish momentum. The Moving Average Convergence Divergence (MACD) indicator also showed a bearish crossover on Monday, giving sell signals. Moreover, the rising red histogram bars below the neutral level also suggest a bearish momentum and continuation of the downward trend.
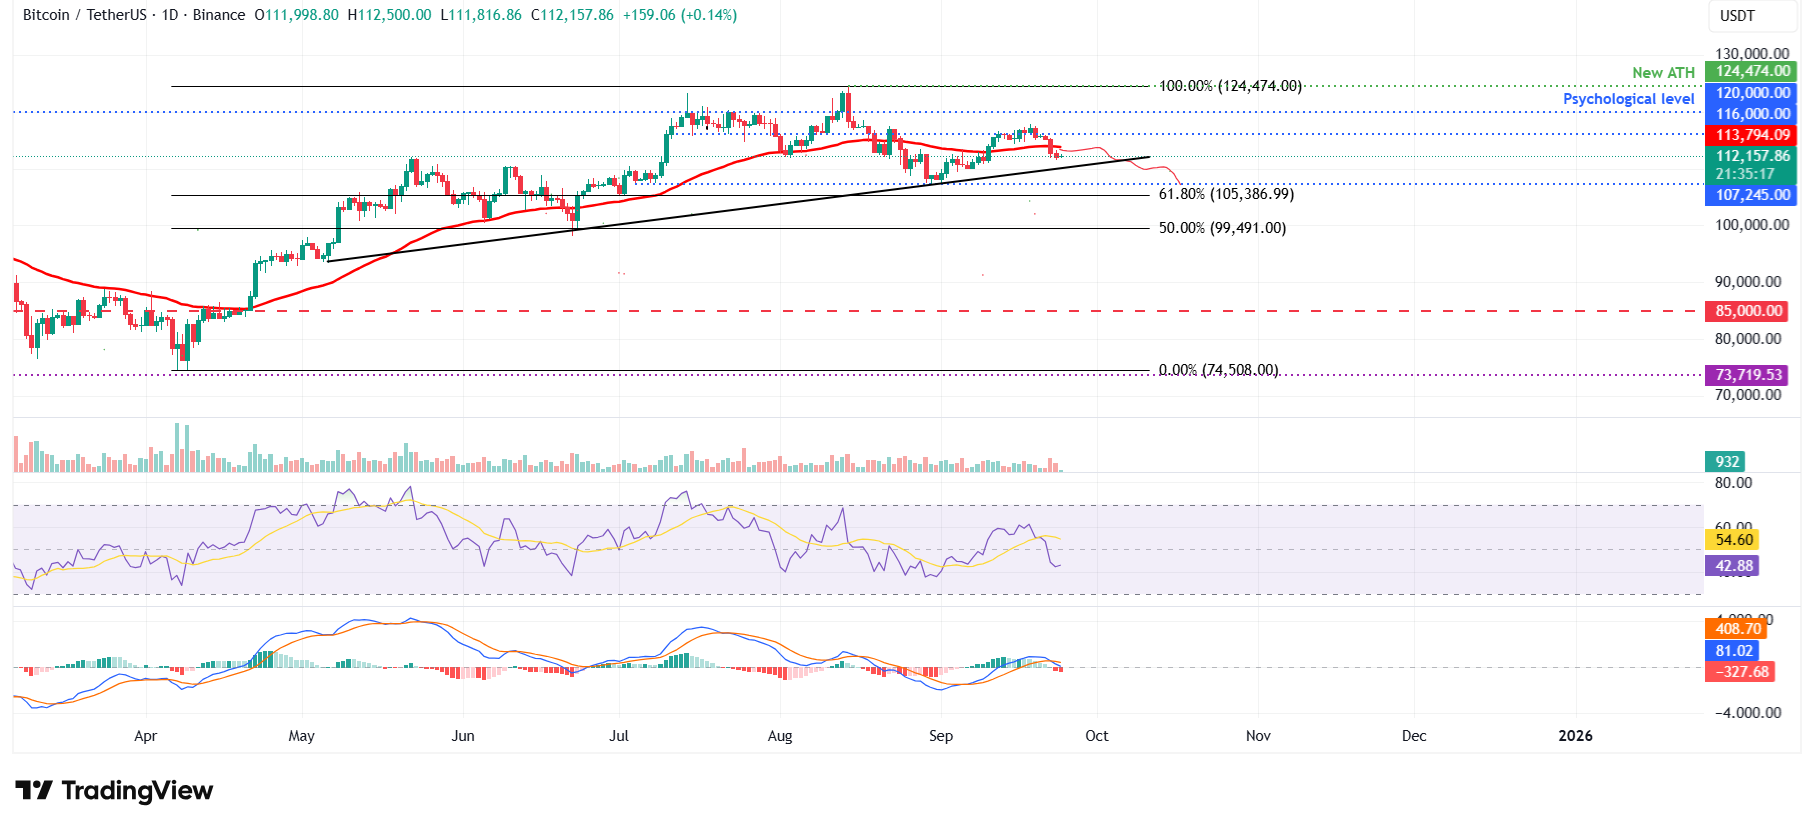
BTC/USDT daily chart
However, if BTC recovers and closes above the 50-day EMA at $113,794, it could extend the recovery toward the daily resistance at $116,000.
Ethereum bears are in control of the momentum
Ethereum price closed below the daily support level at $4,488 on Friday and declined by 6.77% over the next four days, ultimately closing below the next daily support level at $4,232 on Tuesday. At the time of writing on Wednesday, it hovers at around $4,171.
If ETH continues its downward trend, it could extend the decline to retest its 61.8% Fibonacci retracement level at $3,593.
Like Bitcoin, Ethereum’s RSI and MACD indicators also support the bearish view, indicating the continuation of the downward trend.
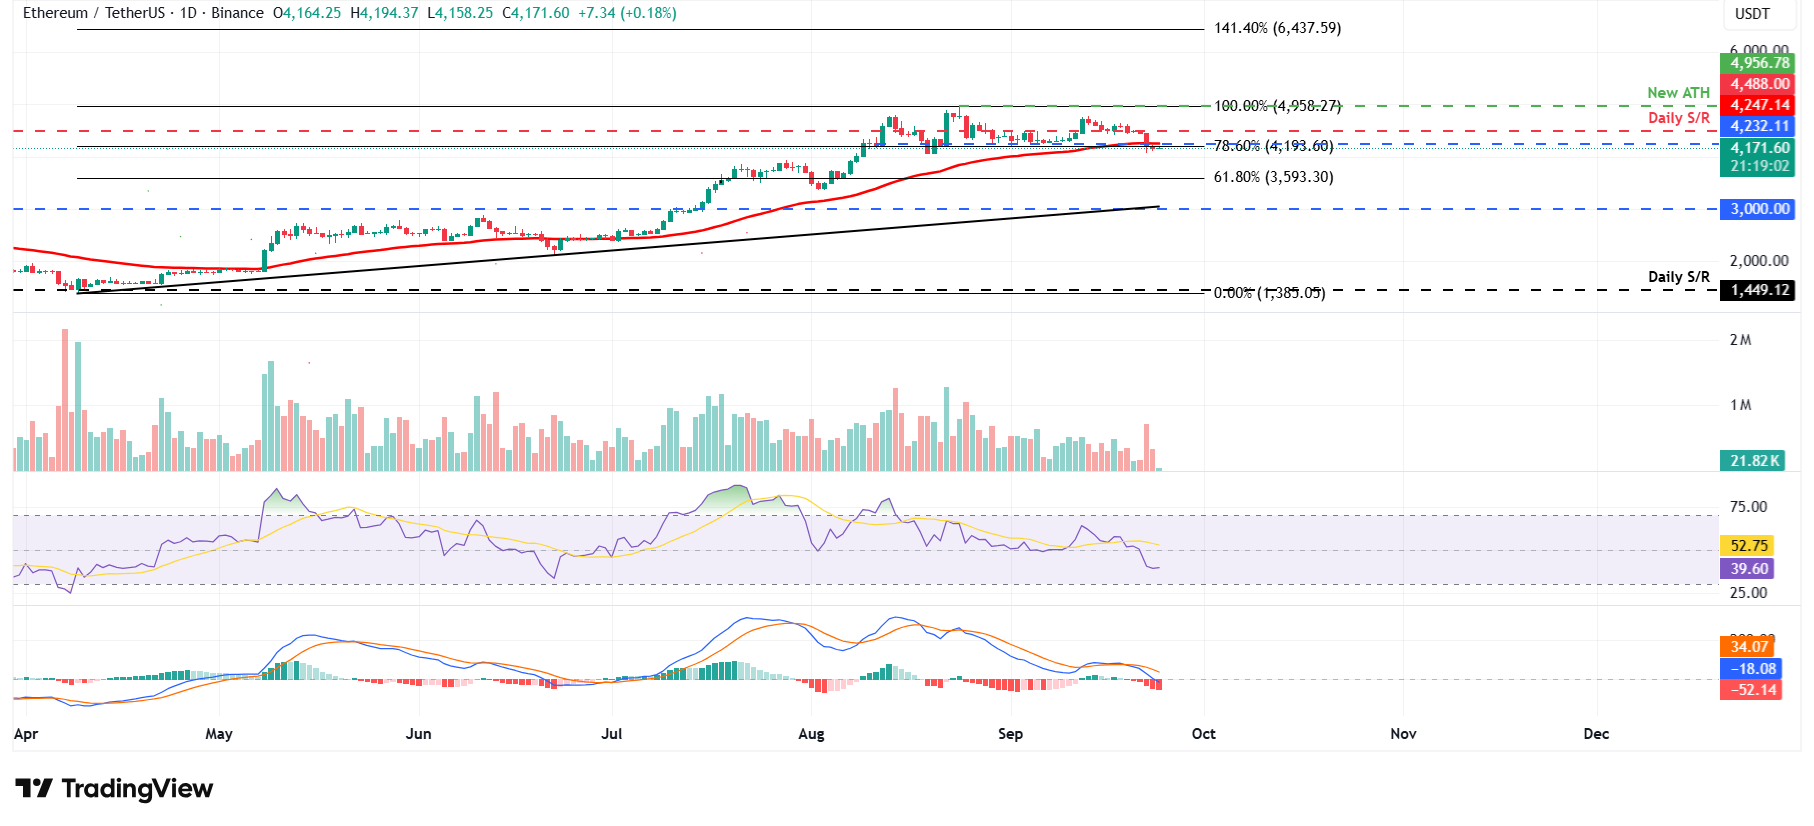
ETH/USDT daily chart
On the other hand, if ETH recovers and closes above the daily resistance at $4,232, it could extend the recovery toward the next daily resistance at $4,488.
XRP bears tighten grip as momentum slows
Ripple’s XRP failed to find support around the 61.8% Fibonacci retracement level at $2.99 on Friday and declined 6.62% by Tuesday. At the time of writing on Wednesday, it hovers at around $2.82.
If XRP continues to correct and closes below the daily support at $2.72, it could extend the decline to retest the next daily support at $2.35.
Like Bitcoin and Ethereum, XRP's momentum indicators also support the bearish view, suggesting a deeper correction ahead.
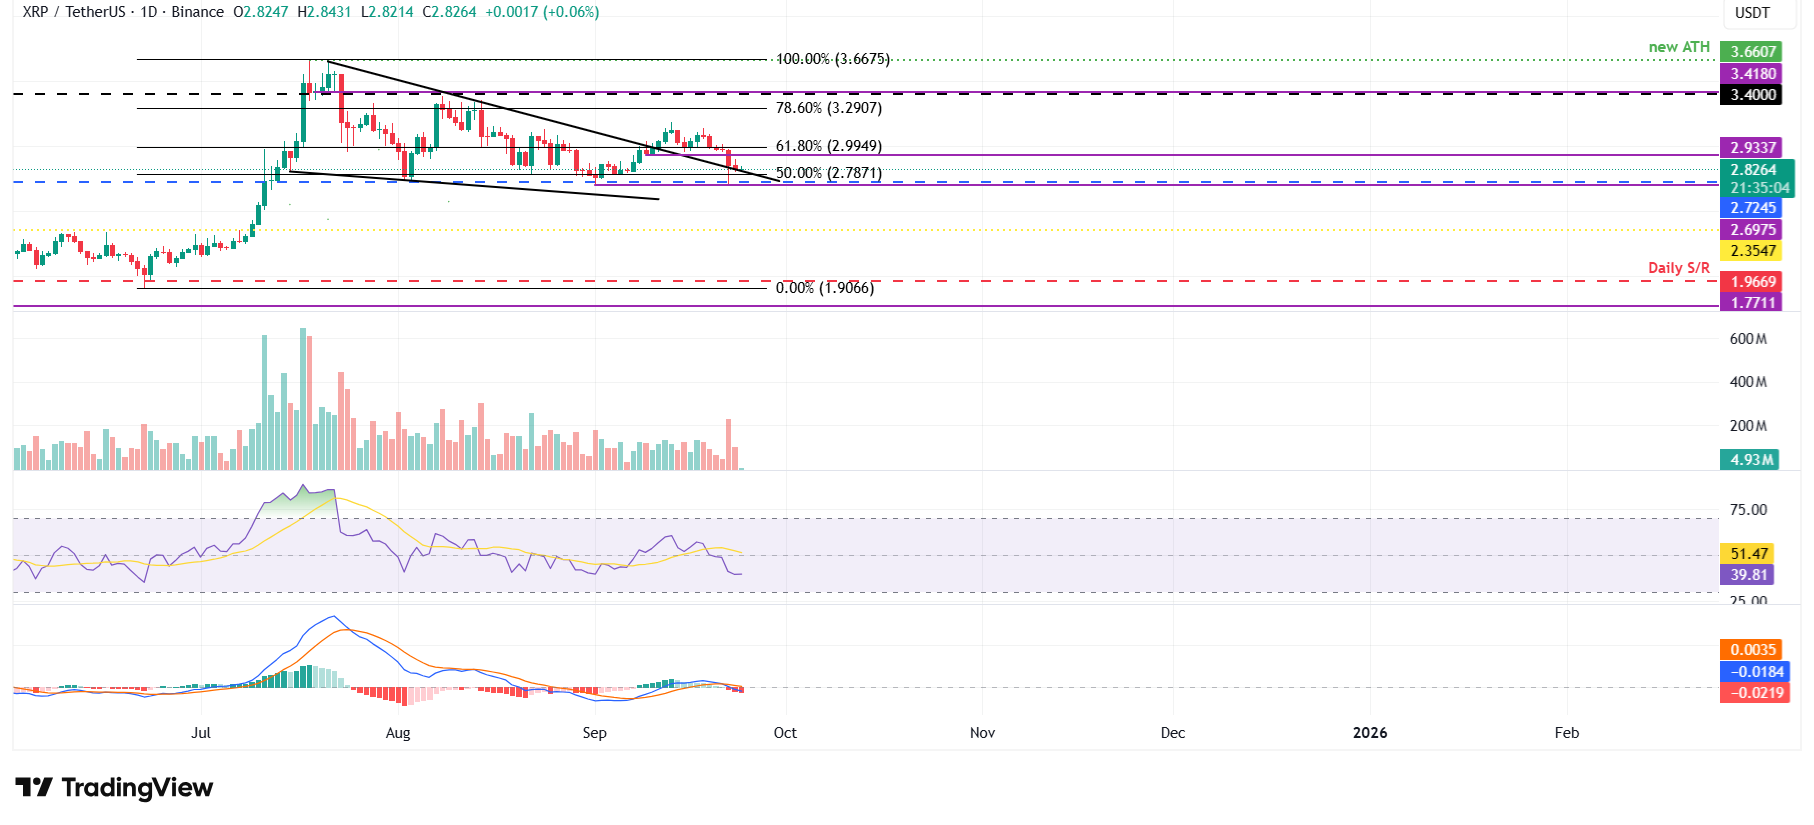
XRP/USDT daily chart
However, if XRP recovers, it could extend the recovery toward the resistance level at $2.99.
Read more
* The content presented above, whether from a third party or not, is considered as general advice only. This article should not be construed as containing investment advice, investment recommendations, an offer of or solicitation for any transactions in financial instruments.


