

Silver Price Analysis: XAG/USD Struggles Near Multi-week Low, Seems Vulnerable to Slide Further

- Gold Price Trend Forecast: Why Did Gold Prices Fall After US CPI Cooled? Fed Chair Speech and Iran Situation Become Obstacles
- Gold Price Trend Forecast: June CPI Plus Fed Chair Congressional Testimony, Can Gold Price Hold Above $4,000?
- TradingKey Daily Market Brief: Gold Falls Below $4,000, TSMC’s Strong Earnings Fail to Stop AI Trade Cooling, Chip Stocks Sold Off
- Gold slides back closer to $4,050 as Iran risks and Fed hike bets boost USD
- Gold Price Forecast: Cooling Inflation Fails to Offset Fed Hawkish Pressure, Gold Price May Fall to $3,500
- Today’s Market Recap: Unexpected PPI Drop Boosts Markets, Apple Hits All-Time High, AI Hardware Stocks Remain Under Pressure, Micron, SanDisk Slump

Silver remains under some selling pressure for the fourth successive day on Thursday.
The technical setup favours bearish traders and supports prospects for deeper losses.
A sustained strength beyond $23.60-70 barrier is needed to negate the negative bias.
Silver (XAG/USD) attracts fresh sellers following an uptick to the $22.65 region and drifts into negative territory for the fourth successive day on Thursday. The white metal extends its intraday descent through the first half of the European session and drops to the $22.35 area in the last hour, back closer to over a three-week low touched on Wednesday.
From a technical perspective, nothing seems to have changed for the XAG/USD and the near-term bias remains tilted firmly in favour of bearish traders. Against the backdrop of the recent repeated failures to find acceptance above the very important 200-day Simple Moving Average (SMA) and the overnight rejection near the $22.85-$22.80 horizontal support breakpoint validates the negative outlook.
Moreover, oscillators on the daily chart have just started drifting in the negative territory and support prospects for an extension of the recent downfall from the $23.60-$23.70 supply zone, which constituted the formation of multiple tops on the daily chart. Some follow-through selling below Wednesday's swing low, around the $22.30 area, will reaffirm the bearish bias and drag the XAG/USD to the $22.00 mark.
The next relevant support near the $21.70 zone, below which the XAG/USD could extend the downward trajectory further towards the $21.35-$21.30 support en route to the $21.00 round figure. Bearish traders might eventually aim to challenge a multi-month low, around the $20.70-$20.65 area touched in October.
On the flip side, the $22.80-$22.85 region might continue to act as an immediate hurdle ahead of the $23.00 mark and the 200-day SMA, currently near the $23.25 region. This is followed by the $23.60-$23.70 supply zone, which if cleared decisively will shift the near-term bias in favour of bullish traders. The XAG/USD might then climb further beyond the $24.00 mark, towards the $24.20-$24.25 intermediate hurdle, before making a fresh attempt to conquer the $25.00 psychological mark.
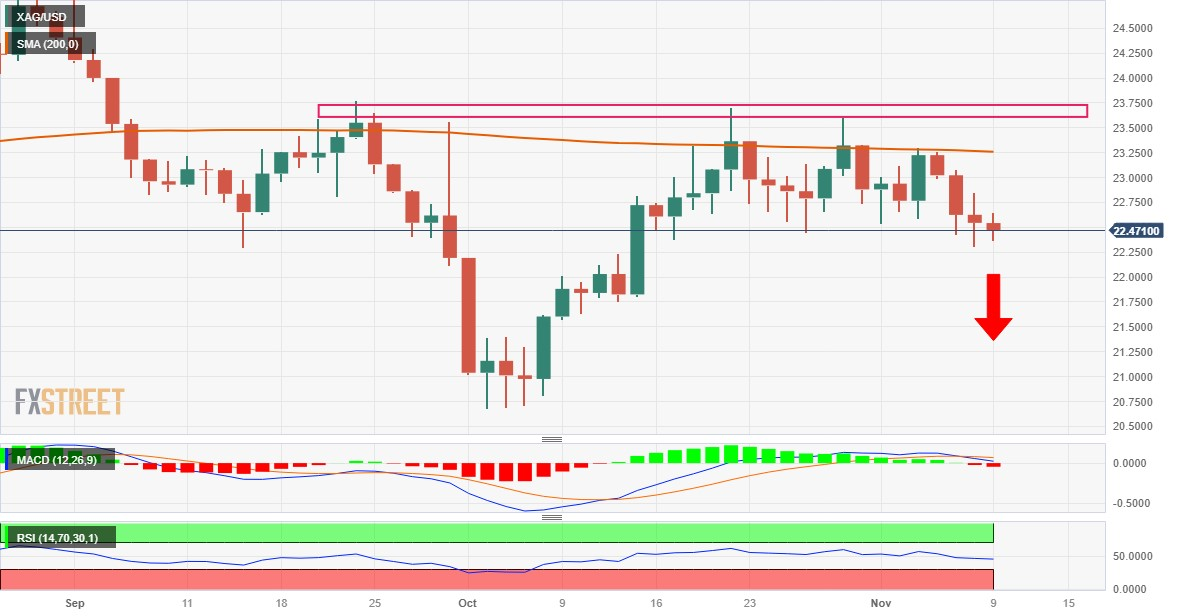
XAG/ USD, Source: FXStreet.
Read more
* The content presented above, whether from a third party or not, is considered as general advice only. This article should not be construed as containing investment advice, investment recommendations, an offer of or solicitation for any transactions in financial instruments.


