

Silver Price Analysis: XAG/USD Remains Below Multi-month-old Descending Trend-line Resistance

- Gold Price Forecast: Gold Poised to Break $4,200 as Oil Price Slump Eases Inflation Fears
- Gold Price Forecast: Oil Price Breaking $100 Fuels Inflation Concerns, Will Gold Prices Fall Further?
- Gold rallies to over two-week high, eyes $4,150 as traders track US-Iran diplomacy efforts
- Middle East War updates: US-Iran pause strikes as Trump weighs up diplomatic options
- WTI climbs above $87.00 as Middle East conflict threatens key choke points
- Today’s Market Recap: Oil Breaks $100, Fueling Inflation Fears, as AI Capex Faces Scrutiny and Tesla’s 14% Plunge Drags Down Tech Sector

XAG/USD attracts fresh buying on Tuesday and reverses the previous day’s slide.
The technical setup favours bullish traders and supports prospects for further gains.
A move beyond a descending trend-line is needed to reaffirm the positive outlook.
Silver (XAG/USD) regains positive traction on Tuesday to reverse the previous day's losses and maintains its bid tone through the first half of the European session. The white metal currently trades around the $23.65-$23.70 region, up 1.0% for the day, and seems poised to appreciate further.
From a technical perspective, the recent pullback from the $24.15 region, or the highest level since September 4, stalled near the very important 200-day Simple Moving Average (SMA) resistance breakpoint, now turned support. The subsequent move up favours bullish traders and supports prospects for a further appreciating move. Moreover, oscillators on the daily chart are holding in the positive territory and are still far from being in the overbought zone, validating the positive outlook for the XAG/USD.
Bulls, however, might wait for a sustained breakout through a downward-sloping trend line extending from the May swing high, currently pegged near the $24.00 mark, before placing fresh bets. The XAG/USD might then aim to surpass the $24.20-$24.25 intermediate resistance and make a fresh attempt towards conquering the $25.00 psychological mark. Some follow-through buying beyond the $25.15-$25.20 region should set the stage for a move towards reclaiming the $26.00 round figure for the first time since May.
On the flip side, the 200-day SMA, currently pegged near the $23.30 region, might continue to protect the immediate downside. Any further decline might still be seen as a buying opportunity and remain limited near the $23.00 mark. That said, a convincing break below the latter might prompt aggressive technical selling and drag the XAG/USD further towards the $22.35-$22.30 zone en route to the $22.00 mark.
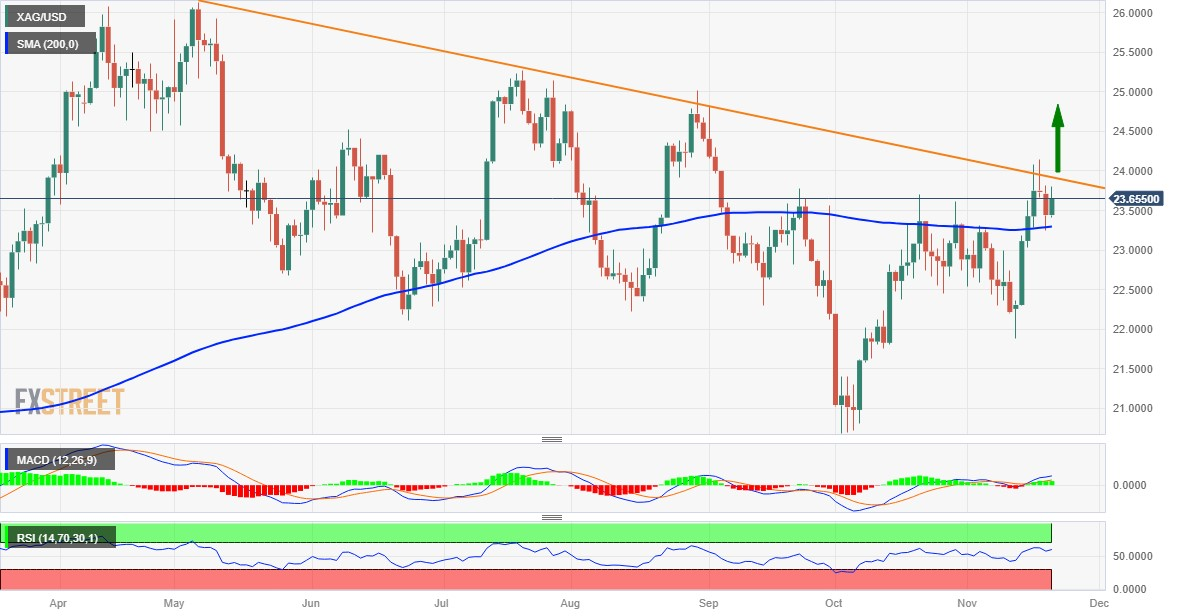
Silver daily chart, Source: FXStreet.
Read more
* The content presented above, whether from a third party or not, is considered as general advice only. This article should not be construed as containing investment advice, investment recommendations, an offer of or solicitation for any transactions in financial instruments.


