


Gold bounces off major trendline, US inflation data incoming


Gold has found support from a major trendline and paused its short-term downtrend.
Gold had been selling off in November amid expectations of interest rates staying elevated in the US.
US CPI inflation data for October could impact interest rate cut expectations and Gold price.
Gold (XAU/USD) trades just above $2,600 on Wednesday after the precious metal’s November sell-off to seven-week lows found technical support at a major trendline. Gold takes a breather as markets wait for the release of key inflation data from the US, which could impact the future trajectory of interest rates, a major driver of the non-interest-paying yellow metal. When interest rates fall, it is favorable for Gold as it makes it more attractive to investors compared to other assets.
Whilst the US Federal Reserve (Fed) had been on course to slash interest rates because of declining inflation and concerns about a weakening labor market – and this drove Gold price to record highs – that all changed with the election of Donald Trump to the White House. Trump’s radical protectionism and “free market” economic policies are likely to drive inflation back up, according to experts, keeping interest rates high – a negative for Gold.
The release of the US Consumer Price Index (CPI) data for October on Wednesday will provide the latest snapshot of the inflation situation and could impact market expectations of whether the Fed will cut interest rates at its December monetary policy meeting. The market-based probabilities are currently 62.1% in favor of a 25 basis point (bps) (0.25%) cut and 37.9% for the Fed to leave interest rates unchanged at 4.50%-4.75%, according to the CME FedWatch. This could shift if CPI surprises from economist’s expectations. Market-watchers are paying particularly close attention to elevated service inflation, which remains much higher than goods inflation and is the main contributor to the still-above-target CPI.
Gold ETF outflows, a factor in the recent decline
Gold price’s decline in November was partly driven by large outflows from US Exchange Traded Funds (ETF). These allow traders to purchase stocks in Gold without investors having to own bullion themselves. Gold ETFs shed around $809 million (12 tonnes) net in early November, driven by North American outflows and partially offset by Asian inflows, according to the World Gold Council (WGC) data.
Demand for Gold is also expected to decline in China, the world’s largest consumer of the yellow metal, amid an economic slowdown that is expected to accelerate as the US imposes higher tariffs on Chinese imports.
Gold is also falling due to competition from alternative assets such as Bitcoin (BTC), which is trading in the high $80,000s, close to all-time highs, because of expectations the Trump administration will relax crypto regulation.
US stocks are also rising as investors anticipate lower corporation tax and looser regulations, boosting company profits, and this might also be diverting funds away from the precious metal.
Gold generally rises as a result of investors seeking safety amid a rise in geopolitical risks. One such risk factor has been the Russia-Ukraine war, which Trump boasted he could bring an end to “in one day – 24 hours.” Still, this has not been the case in reality. Trump is said to have warned Russian President Vladimir Putin “not to escalate in Ukraine” in a telephone call. However, Putin does not appear to have heeded his advice, given reports of Russian casualties continuing to rise.
Another geopolitical hotspot is the Middle East, where the possibility of peace now looks less likely given Trump’s appointment of Former Arkansas Governor Mike Huckabee as Ambassador to Israel. Huckabee is a known Zionist and supporter of Israeli Prime Minister Benjamin Netanyahu. He has said he does not support a two-state solution to the Israeli-Palestinian problem and sees the West Bank as belonging to Israel. His appointment will probably embolden Israel and bring further bloodshed to the region. If tensions rise, it could drive safe-haven flows to Gold.
Technical Analysis: XAU/USD pauses at major trendline
According to technical analysis, the precious metal is now in a short-term downtrend, and, given it is a principle of technical analysis that “the trend is your friend,” the odds favor a continuation lower. However, Gold bounces off support from a major trendline for its long-term uptrend at around the $2,600 mark.
XAU/USD Daily Chart
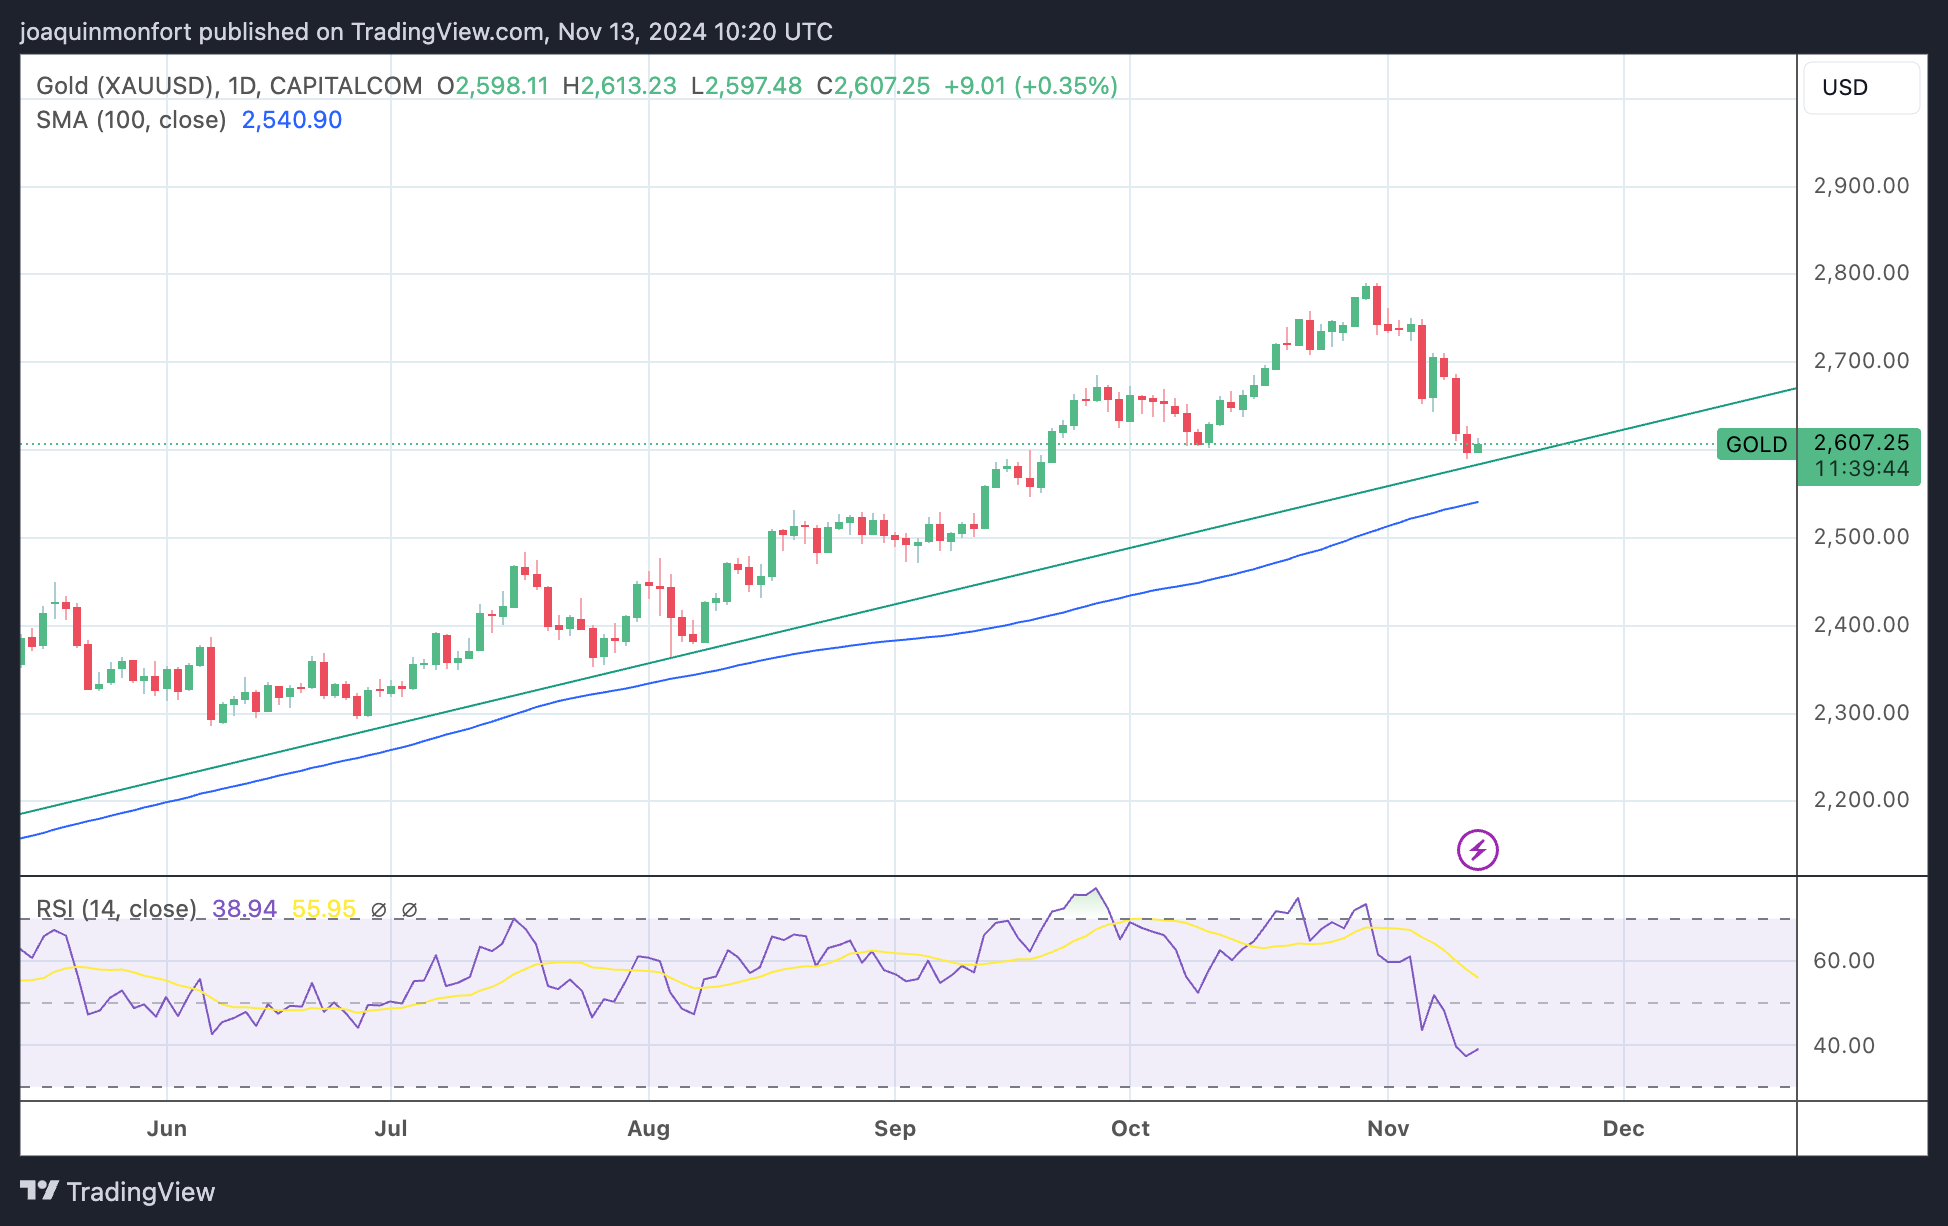
A decisive break below the major trendline would confirm an extension of the short-term downtrend, probably to the next target at $2,540, the 100-day SMA and August highs.
A decisive break would be one accompanied by a longer-than-average red candle that pierced well below the trendline and closed near its low, or three red candles that broke clearly below the trendline.
However, the precious metal remains in an uptrend on a medium and long-term basis, giving the material risk of a reversal higher in line with these broader up cycles.
Read more
* The content presented above, whether from a third party or not, is considered as general advice only. This article should not be construed as containing investment advice, investment recommendations, an offer of or solicitation for any transactions in financial instruments.


