



■Gold price trades on a negative note on the stronger USD on Friday.
■The higher-for-longer US rate narrative weighs on the yellow metal.
■Investors will monitor the Fed’s Waller speech, US Durable Goods Order, and Michigan Consumer Sentiment Index report on Friday.
Gold price (XAU/USD) edges lower to a two-week low on Friday amid renewed US Dollar (USD) demand. The diminishing bets of a rate cut in September from the US Federal Reserve (Fed) exert some selling pressure on the precious metal. Nonetheless, the safe-haven flows amid the rising geopolitical tensions in the Middle East might lift the gold price.
Gold investors will take more cues from the Fedspeak. The Fed’s Waller is set to speak on Friday. The hawkish remarks from the Fed policymakers might further weigh on yellow metal. It’s worth noting that a higher rate generally hurts gold price as it increases the opportunity cost of investing in the yellow metal. Apart from this, the US Durable Goods Order and Michigan Consumer Sentiment Index will be released.
Daily Digest Market Movers: Gold price retreats from record highs amid the Fed’s hawkish stance
The US Initial Jobless Claims fell by 8K to 215K for the week ending May 18. This figure came in lower than the expectation of 220K and the previous week's reading of 223K.
The flash US S&P Global Manufacturing PMI rose to 50.9 in May from 50.0 in April. The Services PMI climbed to 54.8 in May from the previous reading of 51.3. Both figures came in better than the estimation.
The US S&P Global Composite PMI jumped to 54.4 in May from 51.3 in April, beating the market expectation of 51.1, the highest level since April 2022.
Atlanta Fed President Raphael Bostic said that he still sees upward inflation pressure, adding the Fed may need to be more patient to avoid heating the economy.
China’s private sector imported 543 tonnes of gold in Q1 2024, and the People’s Bank of China (PBoC) added another 189 tonnes to its reserves during the same period, according to the latest analysis by Gainesville Coins’ Jan Nieuwenhuijs.
Gold imports to India, the world's second-largest gold consumer, might decline by about a fifth in 2024 as high prices encourage retail customers to exchange old jewelry for new products, per Reuters.
Technical Analysis: Gold price’s bullish outlook remains intact, with a Bearish Divergence in focus
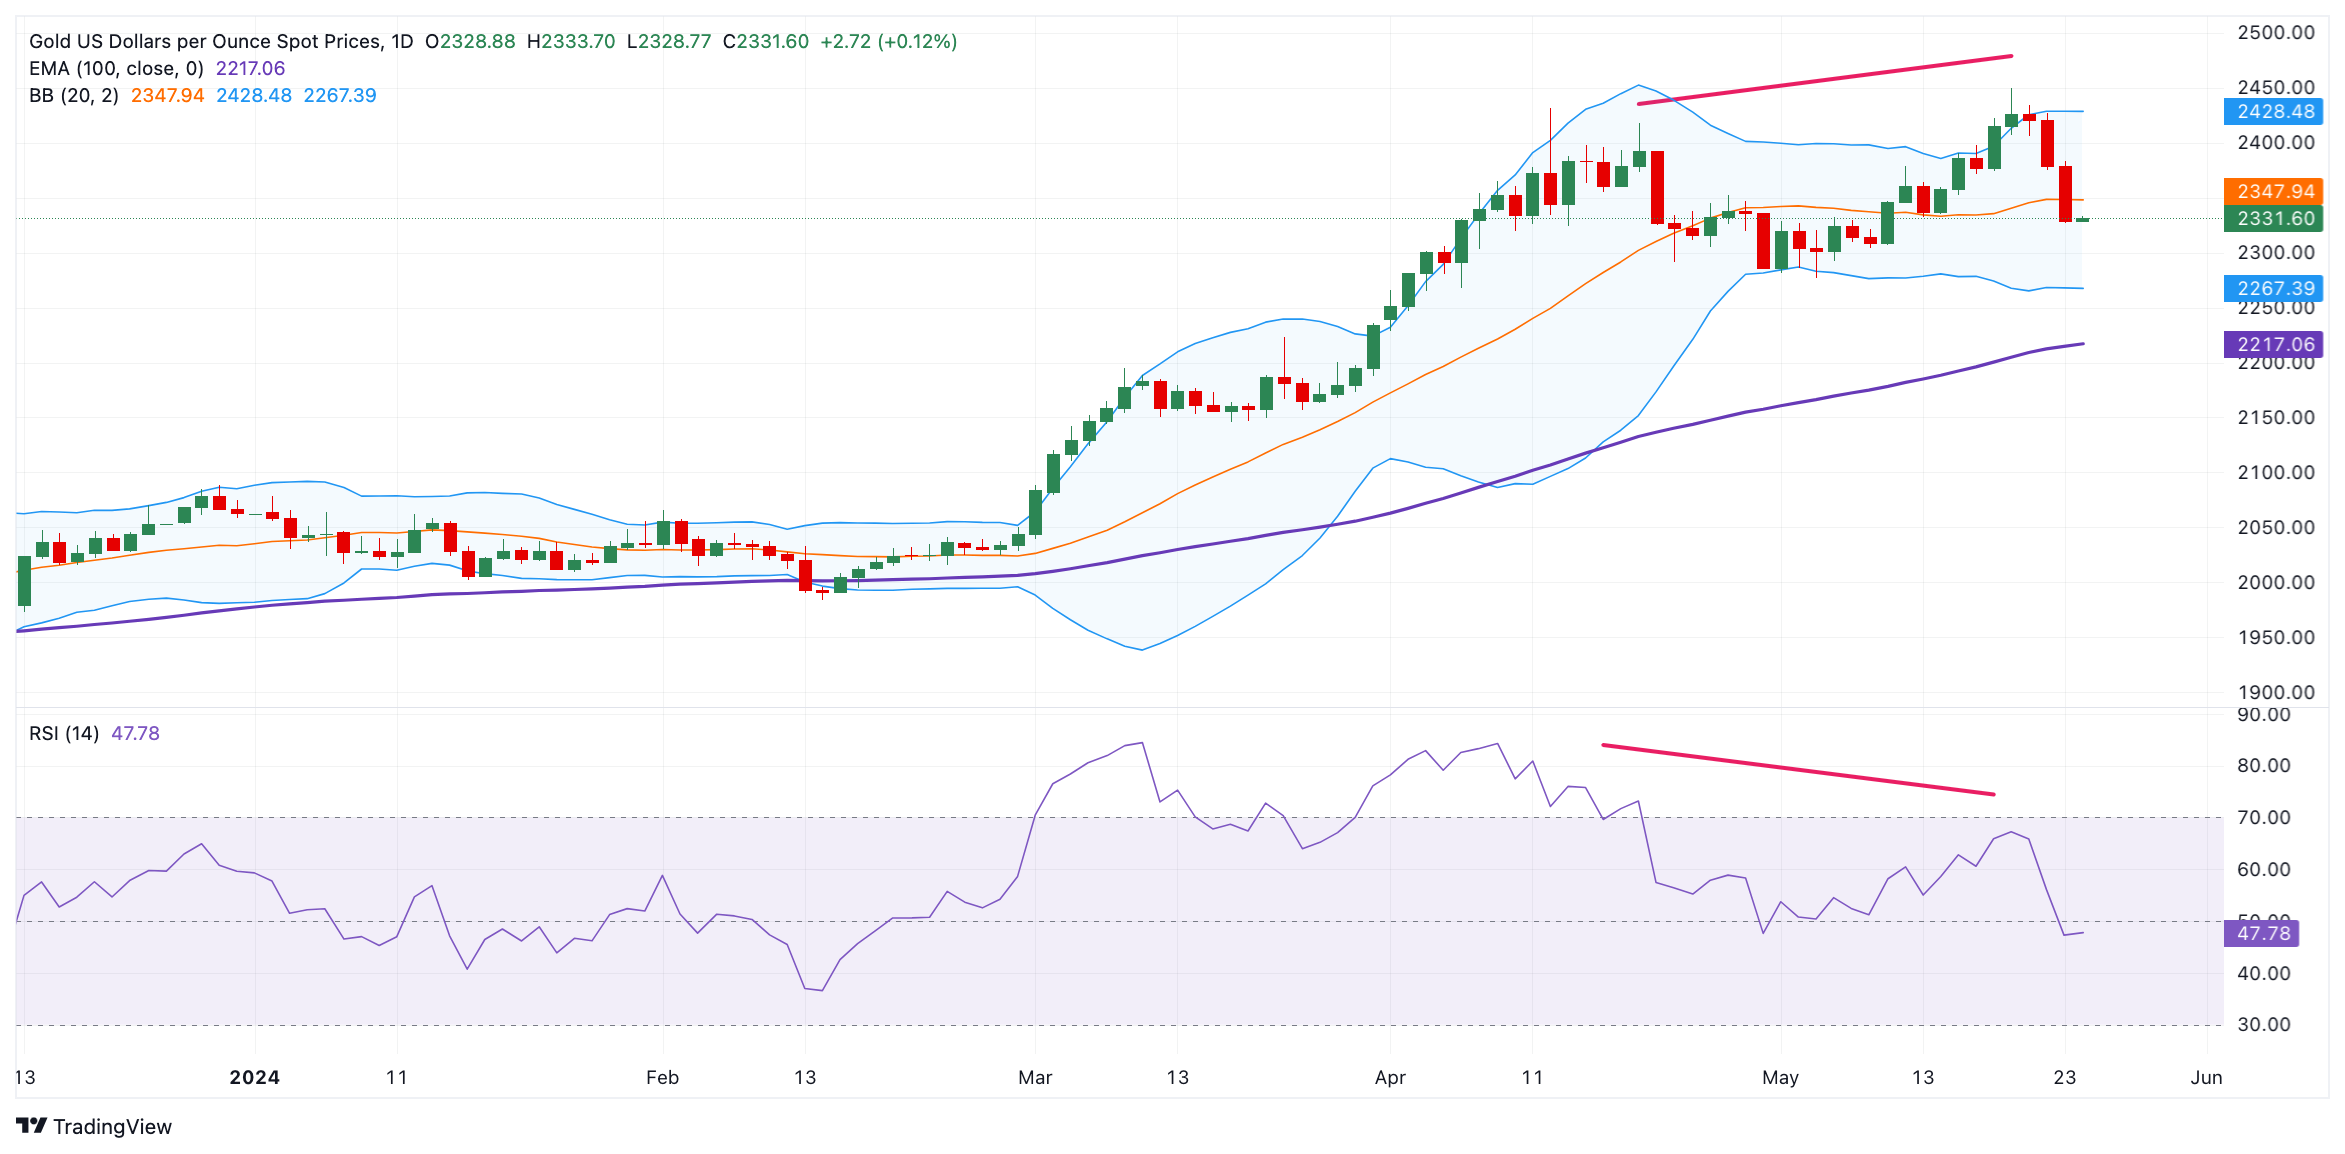
Gold price trades on a weaker note on the day. The precious metal keeps the bullish vibe unchanged on the daily chart as it holds above the key 100-period Exponential Moving Average (EMA). However, the yellow metal has formed a bearish divergence as the price made higher highs on May 20, but the RSI indicator has formed lower highs, suggesting the momentum is slowing and a correction or consolidation in price cannot be ruled out.
The upper boundary of Bollinger Band at $2,428 acts as an immediate resistance level for XAU/USD. A decisive break above this level could resume its climb to an all-time high of $2,450, en route to the $2,500 psychological barrier.
On the flip side, the first downside target will emerge at a low of May 13 at $2,285. Extended losses could take gold lower to the lower limit of the Bollinger Band at $2,267. Further south, the next contention level is seen at the 100-period EMA of $2,217.
US Dollar price today
The table below shows the percentage change of US Dollar (USD) against listed major currencies today. US Dollar was the strongest against the New Zealand Dollar.
| USD | EUR | GBP | CAD | AUD | JPY | NZD | CHF | |
| USD | 0.02% | -0.01% | 0.00% | 0.00% | 0.04% | 0.05% | 0.04% | |
| EUR | -0.02% | -0.02% | -0.01% | 0.00% | 0.03% | 0.05% | 0.01% | |
| GBP | 0.02% | 0.02% | 0.01% | 0.02% | 0.06% | 0.08% | 0.03% | |
| CAD | -0.02% | 0.04% | -0.01% | -0.01% | 0.04% | 0.06% | 0.02% | |
| AUD | 0.00% | 0.01% | -0.02% | 0.00% | 0.03% | 0.05% | 0.04% | |
| JPY | -0.05% | -0.02% | -0.05% | -0.04% | -0.04% | 0.05% | -0.01% | |
| NZD | -0.05% | -0.05% | -0.08% | -0.06% | -0.06% | -0.02% | -0.04% | |
| CHF | -0.04% | 0.00% | -0.04% | -0.03% | -0.03% | 0.01% | 0.01% |
The heat map shows percentage changes of major currencies against each other. The base currency is picked from the left column, while the quote currency is picked from the top row. For example, if you pick the Euro from the left column and move along the horizontal line to the Japanese Yen, the percentage change displayed in the box will represent EUR (base)/JPY (quote).
Read more
* The content presented above, whether from a third party or not, is considered as general advice only. This article should not be construed as containing investment advice, investment recommendations, an offer of or solicitation for any transactions in financial instruments.


