


Silver price may find an initial barrier at $39.13, the highest since September 2011.
The bullish bias gains momentum as the 14-day Relative Strength Index remains above the 50 level.
Immediate support is located at the nine-day Exponential Moving Average, around the $37.79 level.
Silver price (XAG/USD) holds position after registering mild losses in the previous session, trading around $38.20 per troy ounce during the Asian hours on Monday. The technical analysis of the daily chart suggests the price of the precious metal moves upwards within an ascending channel pattern, indicating a persistent bullish bias.
The 14-day Relative Strength Index (RSI) remains above the 50 level, suggesting that bullish bias is strengthening. Additionally, the Silver price is trading above the nine-day Exponential Moving Average (EMA), indicating that short-term price momentum is stronger.
On the upside, the XAG/USD pair may target $39.13, the highest since September 2011, reached on July 14. A successful breach above this level could support the Silver price to explore the region around the upper boundary of the ascending channel around the psychological level of $41.50.
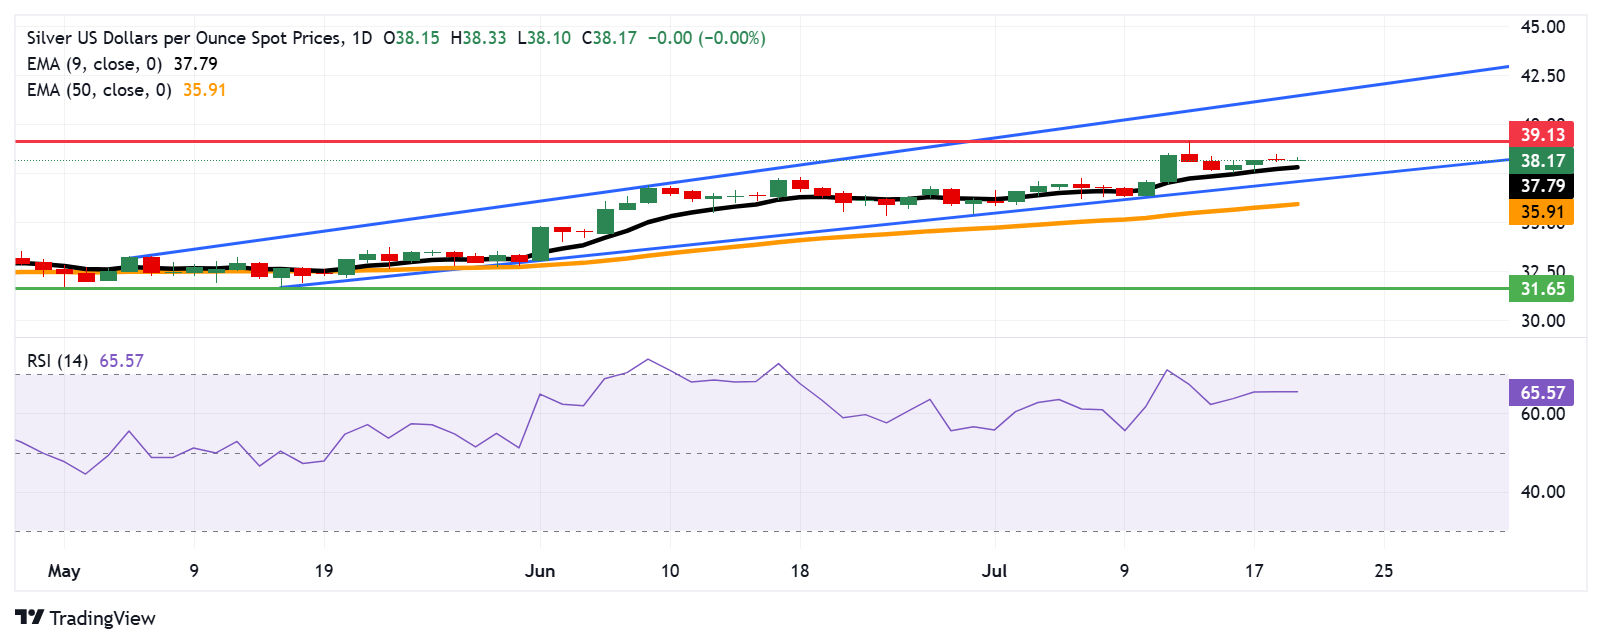
The Silver price may test the immediate support at the nine-day EMA of $37.79, followed by the ascending channel’s lower boundary at $37.20 level. Further declines would weaken the bullish bias and prompt the XAG/USD pair to test the 50-day EMA at $35.91. A break below this level would dampen the medium-term price momentum and prompt the price of Silver to navigate the region around the two-month low at $31.65, which was recorded on May 15.
XAG/USD: Daily Chart
* The content presented above, whether from a third party or not, is considered as general advice only. This article should not be construed as containing investment advice, investment recommendations, an offer of or solicitation for any transactions in financial instruments.


