

Silver Price Analysis: XAG/USD plummets after hitting three-year high, stays bullish

- Gold Price Forecast: Gold Poised to Break $4,200 as Oil Price Slump Eases Inflation Fears
- Gold declines despite easing concerns over inflation, interest rate hikes
- Fed Decision Eve: 104 Economists Expect No Change; Why Is Citadel Securities Betting on a Surprise Hike?
- Gold Price Forecast: Can Gold Hold $4,020 as Fed Rate Hike Expectations Rise?
- Middle East War updates: US-Iran pause strikes as Trump weighs up diplomatic options
- WTI Oil flirts with the $80 level amid speculation about US-Iran peace talks

■Silver pulls back sharply from its highest point since February 2021, suggesting the rally might be overextended.
■If it breaks below key supports at $28.28 and $28.00, further declines to $27.54 and $27.00 could occur.
■A recovery above $28.00 could reignite bullish sentiment, aiming for previous highs and resistances.
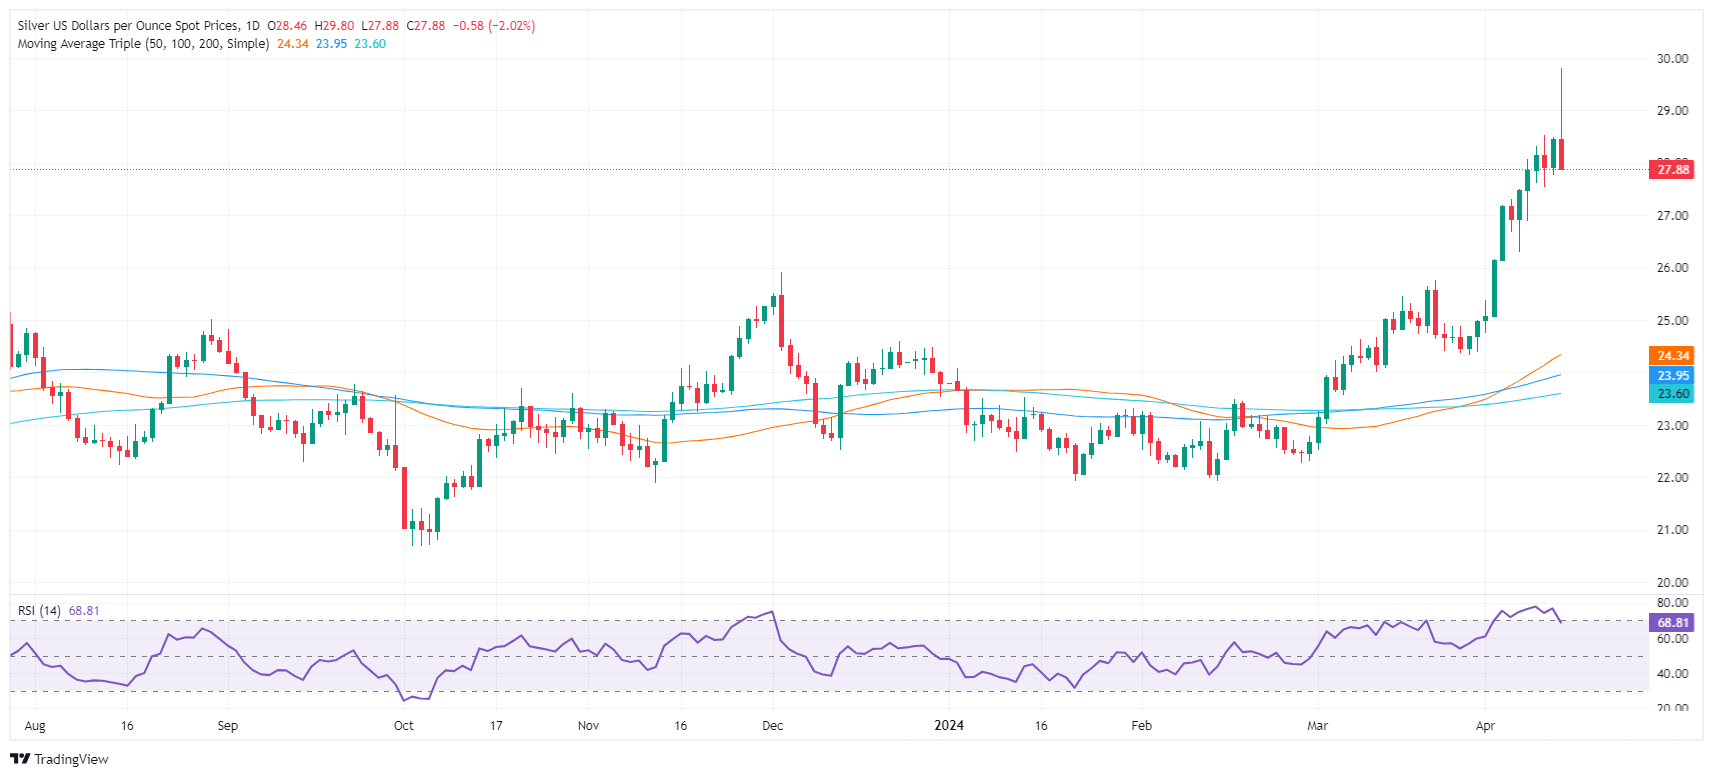
Silver's price tumbled on Friday’s session after refreshing three-year highs reached in February 2021. The grey metal peaked at $29.79 before plunging close to $2.00. The XAG/USD traded at $27.84, down 2.01%.
XAG/USD Price Analysis: Technical outlook
Silver is bullishly biased despite retreating sharply after spiking toward the $29.70s area. However, achieving a daily close below the June 10, 2021, high turned support at $28.28 and clearing below $28.00 has opened the door for a pullback. Therefore, XAG/USD's first support would be the April 10, low at $27.54, ahead of challenging the $27.00 figure. Further losses are seen on May 5, 2023, with high turned support at $26.12.
On the other hand, strong bullish momentum remains, and if buyers reclaim $28.00, that could be put back into the table, the continuation of the rally. The first supply zone would be June 10, 2021, high at $28.28, before testing May 18, 2021, at $28.74. Once surpassed, the next stop would be the year-to-date (YTD) high at $29.79.
XAG/USD Price Action – Daily Chart
Read more
* The content presented above, whether from a third party or not, is considered as general advice only. This article should not be construed as containing investment advice, investment recommendations, an offer of or solicitation for any transactions in financial instruments.


