

Silver Price Analysis: Breaking Monthly Resistance, Refreshing Two-Week Highs, and Surpassing $23.00

- Gold Price Trend Forecast: Why Did Gold Prices Fall After US CPI Cooled? Fed Chair Speech and Iran Situation Become Obstacles
- Gold Price Trend Forecast: June CPI Plus Fed Chair Congressional Testimony, Can Gold Price Hold Above $4,000?
- TradingKey Daily Market Brief: Gold Falls Below $4,000, TSMC’s Strong Earnings Fail to Stop AI Trade Cooling, Chip Stocks Sold Off
- Gold Price Forecast: Cooling Inflation Fails to Offset Fed Hawkish Pressure, Gold Price May Fall to $3,500
- Tesla Q2 Earnings Preview: Record Deliveries Fail to Hide Profit Pressure, Can Musk Rely on AI and Autonomous Driving to Unlock New Growth Space?
- Today’s Market Recap: Unexpected PPI Drop Boosts Markets, Apple Hits All-Time High, AI Hardware Stocks Remain Under Pressure, Micron, SanDisk Slump

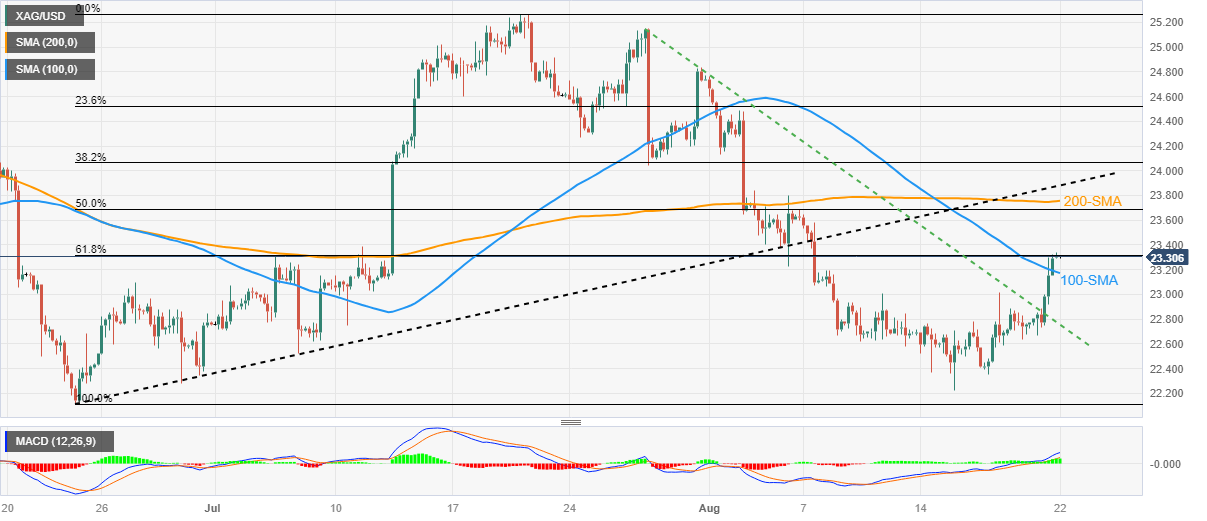
The silver price achieved its largest increase since mid-July, following its approach to the highest level in two weeks.
Silver price broke a month-long downtrend line and provided a favorable breakthrough for the bulls by surpassing the 100-day moving average. However, the 200-day moving average and the previous support line since June will pose a challenge for the bulls.
During Tuesday's early Asian session, the silver price reached $23.30 but remained near the highest level in two weeks.
The rise in silver price surpassed the month-long downtrend line, and the breakthrough of the 100-day moving average along with the bullish signal from the MACD indicator attracted the bulls.
As a result, the silver price may potentially break the 200-day moving average level of around $23.75. However, the resistance line formed after the support reversal since late June (near $23.90 at the time of writing) will be the target for the bulls.
Subsequently, the $24.00 level could serve as further resistance for silver bulls, followed by a test of the swing high near $24.85 from late July.
On the other hand, the $23.00 whole number and the short-term support level of the 100-day moving average (around $23.15) will act as support for the silver price.
Similarly, the recent significant resistance since late July is now around $22.75 and presents a challenge for the bears.
If the silver price falls below $22.75 and continues bearish, it could potentially decline to the June low of $22.11 and the $22.00 level.
Overall, following a significant rise the previous day, silver bulls have regained dominance.
Silver Price: 4-hour chart
Trend: Expected to continue rising
Read more
* The content presented above, whether from a third party or not, is considered as general advice only. This article should not be construed as containing investment advice, investment recommendations, an offer of or solicitation for any transactions in financial instruments.


