


Amid the Power Boom, Should You Buy a Clean Energy ETF or a Nuclear and Uranium ETF?
Key Points
VanEck Uranium and Nuclear ETF offers a higher trailing-12-month dividend yield than iShares Global Clean Energy ETF.
iShares Global Clean Energy ETF provides a lower expense ratio for investors seeking broad exposure to renewables.
VanEck Uranium and Nuclear ETF has demonstrated significantly higher total returns and lower price volatility over the past five years.
- 10 stocks we like better than VanEck ETF Trust - VanEck Uranium And Nuclear ETF ›
Investors looking to capitalize on the global transition toward carbon-free power often choose between broad renewable energy strategies and specialized sub-sectors.
The VanEck Uranium and Nuclear ETF (NYSEMKT:NLR) offers concentrated exposure to the nuclear supply chain with higher yields, while the iShares Global Clean Energy ETF (NASDAQ:ICLN) provides broader, lower-cost access to renewable utilities.
While both funds target the decarbonization of the power grid, they diverge significantly in their underlying technologies, cost structures, and historical risk-adjusted performance.
Snapshot (cost & size)
| Metric | ICLN | NLR |
|---|---|---|
| Issuer | iShares | VanEck |
| Expense ratio | 0.39% | 0.52% |
| 1-yr total return (as of June 18, 2026) | 67.9% | 19.47% |
| Dividend yield | 1.3% | 2.7% |
| Beta | 1.09 | 0.83 |
| AUM | $3.1 billion | $4.6 billion |
Beta measures price volatility relative to the S&P 500; beta is calculated from five-year monthly returns. The 1-yr return represents total return over the trailing 12 months. Dividend yield is the trailing-12-month distribution yield.
The iShares fund is the more affordable option for long-term holders with a 0.39% expense ratio. However, the VanEck fund may appeal to income-oriented investors, as it offers a higher payout with a 2.7% trailing-12-month distribution yield.
Performance & risk comparison
| Metric | ICLN | NLR |
|---|---|---|
| Max drawdown (5 yr) | (57.10%) | (30.50%) |
| Growth of $1,000 over 5 years (total return) | $1,006 | $2,686 |
What's inside
The VanEck Uranium and Nuclear ETF focuses exclusively on the nuclear energy sector, tracking companies engaged in uranium mining, nuclear reactor construction, and nuclear-generated electricity. Launched in 2007, the fund maintains a concentrated portfolio of 29 holdings, primarily located in energy (45.00%), utilities (38.00%), and industrials (15.00%). Its largest positions include Cameco (NYSE:CCJ) at 8.21%, Constellation Energy (NASDAQ:CEG) at 8.03%, and Bwx Technologies (NYSE:BWXT) at 7.02%. The fund has a trailing-12-month dividend of $3.17 per share and provides direct exposure to the nuclear fuel cycle without specific ESG screening mandates.
In contrast, the iShares Global Clean Energy ETF provides a more diversified approach to the sustainable energy market, with a heavy emphasis on solar, wind, and hydrogen technologies. Launched in 2008, it holds 10 positions across utilities (35%), industrials (26%), and energy (25%). Its largest positions include Bloom Energy (NYSE:BE) at 15.55%, First Solar (NASDAQ:FSLR) at 8.9%, and Nextpower (NASDAQ:NXT) at 7.5%. This fund has a trailing-12-month dividend of $0.27 per share and focuses on growth-oriented renewable technology companies rather than resource extraction.
For more guidance on ETF investing, check out the full guide at this link.
What this means for investors
We are in the middle of a global energy crunch. Between the exploding power demands of artificial intelligence (AI) data centers, electric vehicles, and advanced manufacturing, the world needs an unprecedented amount of electricity.
Because governments and corporations are also increasingly bound by carbon-reduction mandates, they cannot simply burn more coal or gas to solve the power crisis. The world needs more clean energy, whether it is renewables such as wind, solar, and hydro, or nuclear energy — also the only zero-emission energy source capable of producing 24/7 baseload electricity. The iShares Global Clean Energy ETF and the VanEck Uranium and Nuclear ETF are two top ETFs to play the power boom.
The iShares ETF gives you exposure to renewables companies across the globe. As of June 18, 48.75% of the fund’s market value was based in the U.S., while China was the second-largest market at 18.48%. India, Brazil, and Denmark are other notable regions the fund tracks.
Unfortunately, the ETF has significantly underperformed the VanEck fund over the past few years. That’s because despite the dire need for more renewable energy, soaring costs of raw materials, high interest rates, the flooding of cheap components such as solar panels from China, and local policy shifts have hurt profitability and the fund’s performance.
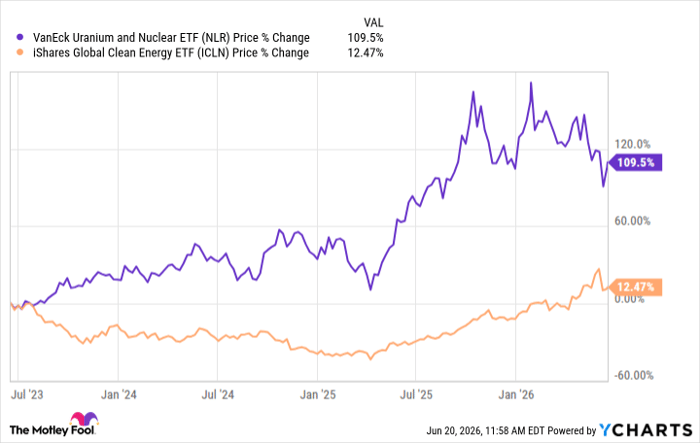
NLR data by YCharts
The nuclear energy industry, on the other hand, has found significant backing from the Trump administration and corporates. Tech giants with zero-carbon mandates are aggressively turning to nuclear energy.
Because the VanEck Uranium and Nuclear ETF covers all aspects of the industry, from miners and processors of nuclear fuel (uranium) to builders of nuclear reactors and power facilities to energy producers, the fund has delivered solid returns in recent years. It essentially captures the upside in uranium price as well as the stable, premium cash flows of the electricity providers.
Should you buy stock in VanEck ETF Trust - VanEck Uranium And Nuclear ETF right now?
Before you buy stock in VanEck ETF Trust - VanEck Uranium And Nuclear ETF, consider this:
The Motley Fool Stock Advisor analyst team just identified what they believe are the 10 best stocks for investors to buy now… and VanEck ETF Trust - VanEck Uranium And Nuclear ETF wasn’t one of them. The 10 stocks that made the cut could produce monster returns in the coming years.
Consider when Netflix made this list on December 17, 2004... if you invested $1,000 at the time of our recommendation, you’d have $417,305!* Or when Nvidia made this list on April 15, 2005... if you invested $1,000 at the time of our recommendation, you’d have $1,293,148!*
Now, it’s worth noting Stock Advisor’s total average return is 936% — a market-crushing outperformance compared to 209% for the S&P 500. Don't miss the latest top 10 list, available with Stock Advisor, and join an investing community built by individual investors for individual investors.
See the 10 stocks »
*Stock Advisor returns as of June 21, 2026.
Neha Chamaria has no position in any of the stocks mentioned. The Motley Fool has positions in and recommends BWX Technologies, Bloom Energy, Cameco, Constellation Energy, First Solar, and Nextpower. The Motley Fool has a disclosure policy.
Recommended Articles


